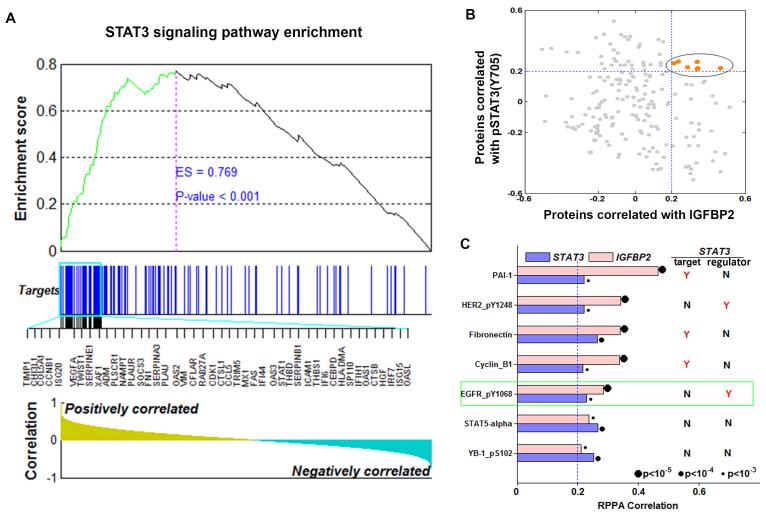
Figure 2. IGFBP2 is strongly and significantly correlated with STAT3 pathway genes.
(A) GSEA demonstrated enrichment for STAT3 target genes based on correlation with IGFBP2 expression in the TCGA low-grade glioma database. The top of the panel shows the enrichment score (ES) for genes associated with STAT3 signaling pathway targets. The blue lines indicate where the STAT3 target genes appear in the ranked gene list, and the black lines represent the top 45 highly correlated targets. The bottom of the panel shows the ranking scores (correlation of all genes associated with the STAT3 signaling pathway targets with IGFBP2). (B) Correlation of expression of proteins in the TCGA RPPA data with IGFBP2 (x-axis) and pSTAT3(Y705) (y-axis). Each dot represents a protein. Proteins with correlation coefficients greater than 0.2 are highlighted in orange. (C) Correlation of the 7 proteins with the highest correlation coefficients with both IGFBP2 and STAT3. Also shown is the relationship of each protein with STAT3 (“target” = STAT3 transcriptional target; “regulator” = STAT3 upstream regulator). Y = yes, a known target or upstream regulator of STAT3; N = not a known target or upstream regulator of STAT3.

