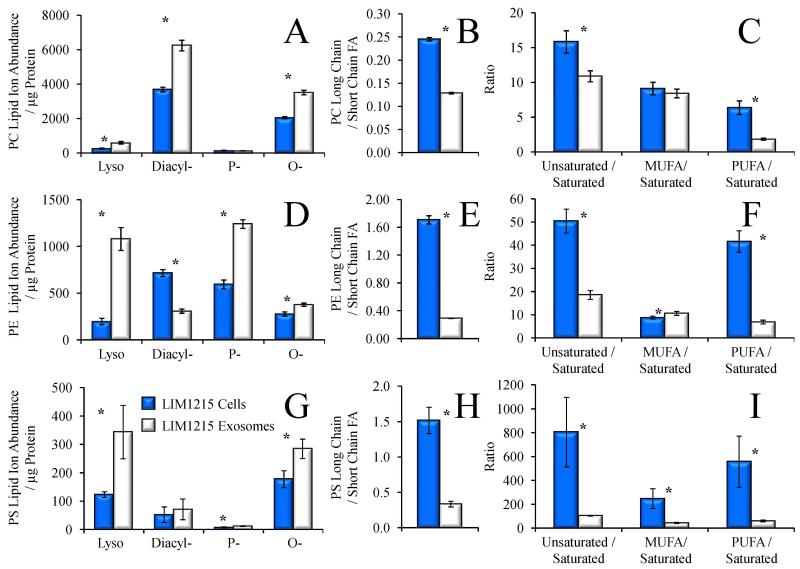
Figure 6.
Characterization of phospholipid subclasses and fatty acid ratios from the data in Figure 1. Comparison of A) the total lipid ion abundances (normalized to protein) of PC lyso-, diacyl-, plasmalogen (P-), and alkyl ether (O-) subclasses, B) the ratio of the total abundance of PC species containing at least one long chain fatty acid (≥ 20 carbons) to PC species containing only short chain fatty acids, and C) the ratio of the abundance of PC species containing at least one unsaturated double bond to PC species containing only saturated fatty acids in LIM1215 cells (dark bars) and LIM1215 secreted exosomes (white bars). Comparison of D) the lipid ion abundance (normalized to protein) of PE lyso-, diacyl-, plasmalogen (P-), and alkyl ether (O-) subclasses, E), the ratio of the abundance of PE species containing at least one long chain fatty acid (≥ 20 carbons) to PE species containing only short chain fatty acids, and F) the ratio of the abundance of PE species containing at least one unsaturated double bond to PE species containing only saturated fatty acids in LIM1215 cells (dark bars) and LIM1215 secreted exosomes (white bars). MUFA, monounsaturated fatty acid. PUFA, polyunsaturated fatty acid. Error bars show the standard deviations determined by triplicate measurement. * P < 0.05.

