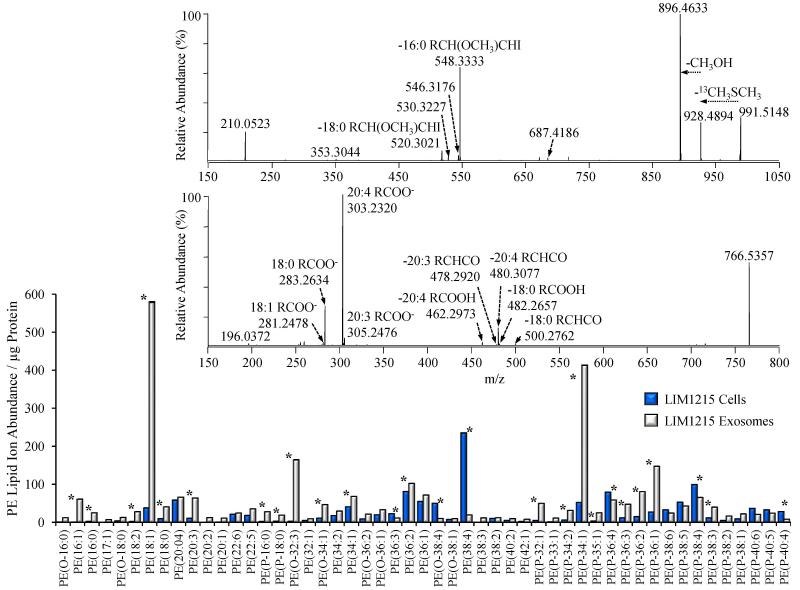
Figure 7.
Identification of LIM1215 cell and secreted exosome PE, P-PE, O-PE, LPE, P-LPE and O-LPE lipid species by high resolution / accurate mass HCD-MS/MS. Only the top 50 most abundant lipids are shown for clarity. Comparison of the total lipid ion abundances (normalized to protein) of PE molecular species in LIM1215 cells (dark bars) and LIM1215 secreted exosomes (white bars) assigned by positive ionization mode accurate mass spectrometry from the data in Figure 1. Error bars show the standard deviations determined by triplicate measurement. * P < 0.05. Top Inset: Positive ionization mode high resolution (R=100,000) HCD-MS/MS analysis to confirm the identity of the assigned PE(P-34:1) lipid, acquired from the LIM1215 exosome lipid extract derivatized with 13C1-DMBNHS and iodine/methanol. Bottom Inset: Negative ionization mode high resolution (R=100,000) HCD-MS/MS analysis to confirm the identity of the assigned PE(38:4) lipid, acquired from an underivatized LIM1215 cell lipid extract. Key product ions used for structural characterization are labeled.

