
Figure 4.
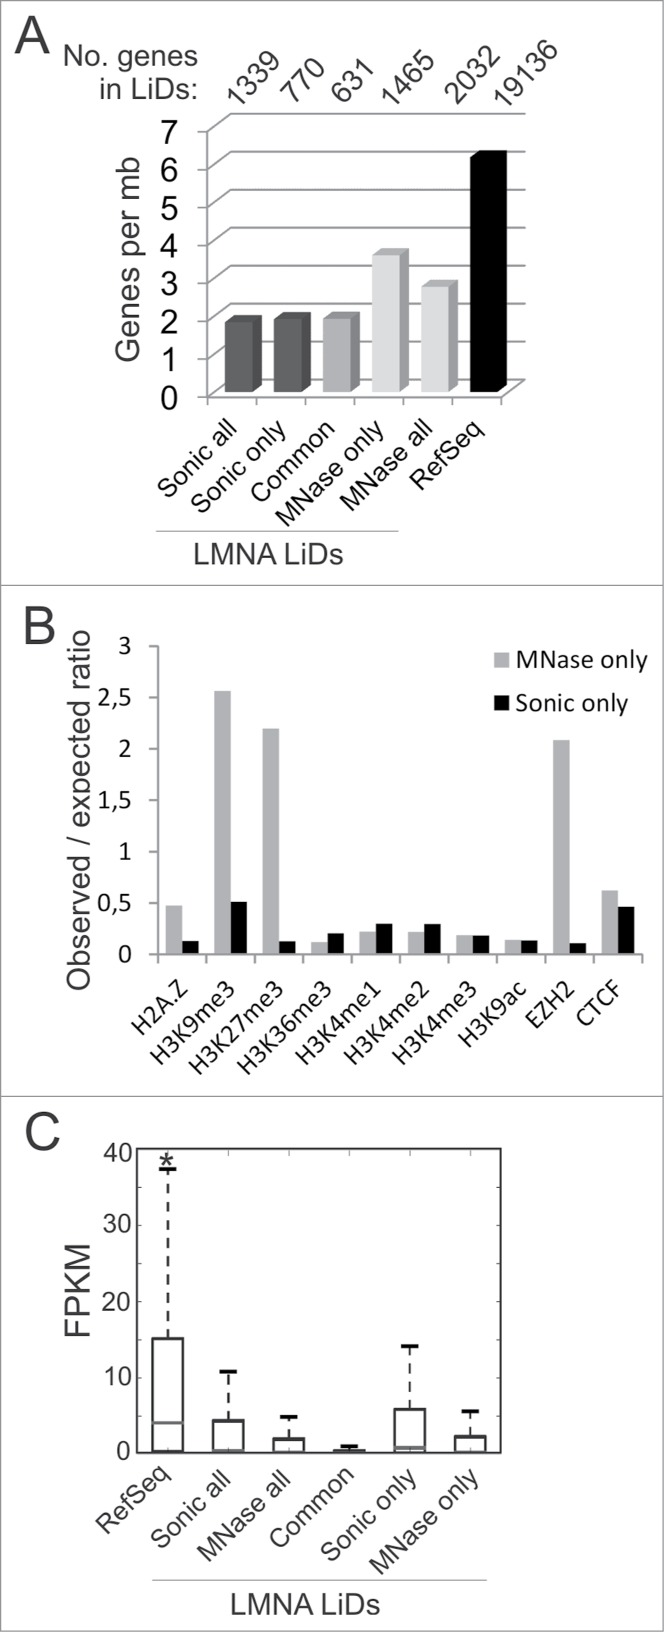
Genomic, epigenetic and gene expression characterization of LMNA LiDs mapped to sonicated and MNase-digested chromatin. (A) Number of protein-coding RefSeq genes per megabase of genome in LiDs unique or common to sonicated or MNase-digested chromatin. Genes were attributed to LiDs based on localization of the TSS within or outside a LiD. Since genes may have more than one TSS, one gene may be attributed to more than one group, explaining why numbers of genes in “all, only or common” categories do not add up. (B) Observed/expected ratios of enrichment in indicated chromatin marks mapped by ChIP-seq in HeLa cells, determined from public ENCODE data. Genome coverage by each mark is shown in Table 1. (C) Median expression level of expressed RefSeq genes (FPKM > 0) included in these LiDs, relative to expression level of all RefSeq genes in the genome. *P < 10−38, Wilcoxon rank-sum test, relative to all other categories.