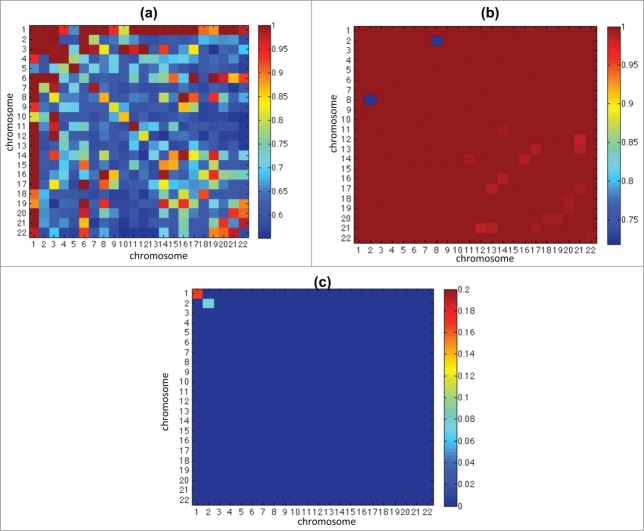
Figure 2.
This figure shows the p-values of the distribution test of intra- and inter-chromosome matrices between 2D and 3D cases (see Local Analysis under Materials and Methods). Fig. 2(a, b) shows the p-values of test within 2D and 3D replicates respectively, and shows there is no significant difference within replicates. Figure 3(c) shows that most blocks have very small p value, which implies significant difference.

