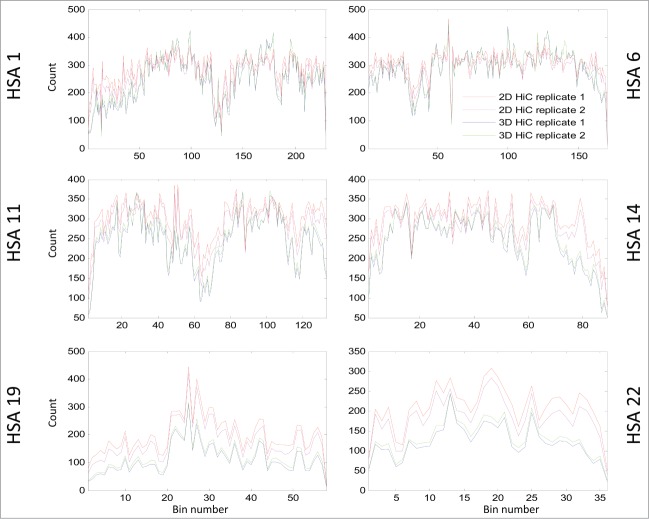
Figure 6.
This line plot shows RPM normalized inter-bin mega base bin sums generated from 2D cells and 3D spheroids. This was calculated by taking the sum of counts in each bin with the diagonal removed. Globally decreased interaction are seen on all chromosomes displayed (HSA 1, 6, 11 14, 19, 22). On the X-axis are the coordinates of DNA sequence in mega base from pter to qter of each correspondence chromosome. The Y-axis indicates the bin counts. Lines in blue and cyan indicate counts for spheroids, and lines in red and magenta represent counts from 2D cells.

