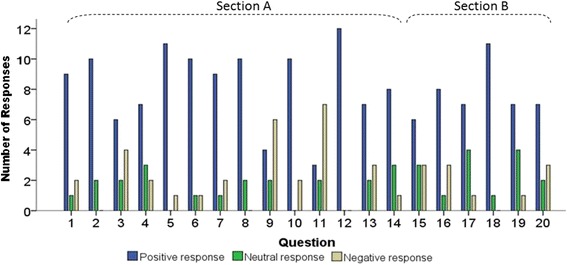
Fig. 4.

Total number of positive, neutral and negative responses to each question, pooling responses of junior residents and of senior Otolaryngologists. The blue bar indicates the number of positive responses (score ≥ 5), the green bar is the number of neutral responses (score = 4), and the beige bar indicates the number of negative responses (score ≤ 3)
