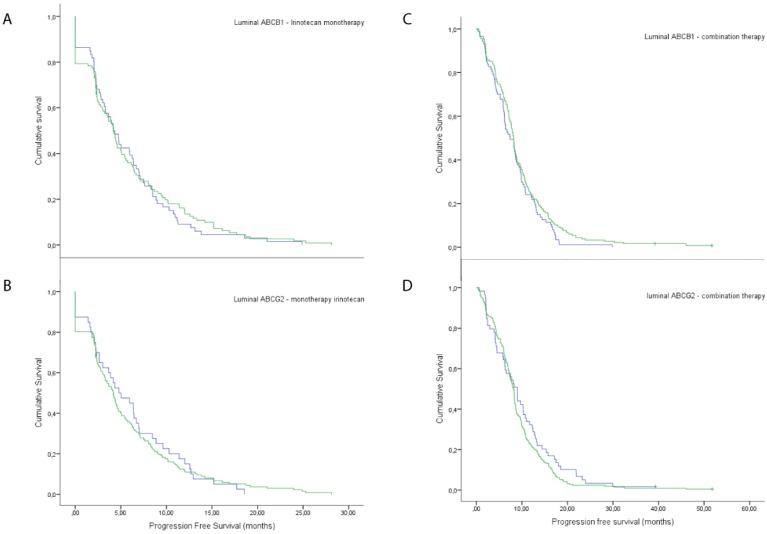
Figure 3.
Response rates on irinotecan treatment. Response rates of patients with negative luminal expression versus positive, when treated with irinotecan monotherapy, A) ABCB1 and B) ABCG2. Response rates of patients with negative luminal expression versus positive, when treated with combination therapy of irinotecan and capecitabine, C) ABCB1 and D) ABCG2.

