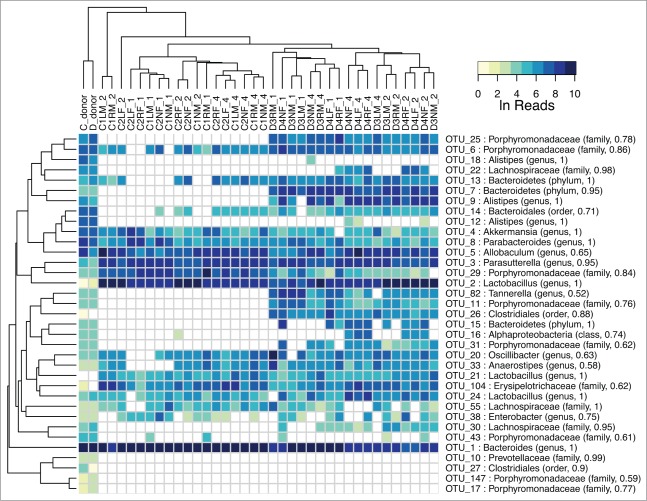
Figure 6.
Heat map of major OTU relative abundances in the fecal transplant experiment using 2 different donor samples from mice fed a control and a high vitamin D diet. The Ln of the normalized reads per OTU is shown. The hierarchical clustering was performed using average linkage of samples and OTUs based on Bray–Curtis dissimilarity index of relative abundance profiles. The sample names indicate diet of donors (C for control, D for high vitamin D), cage number (1, 2, 3), ear tag (R for right, L for left, N for none), sex (M, F), and week (1, 2, 4) preceded by an underscore. There is a strong tendency for the week 2 and 4 samples to cluster by diet.

