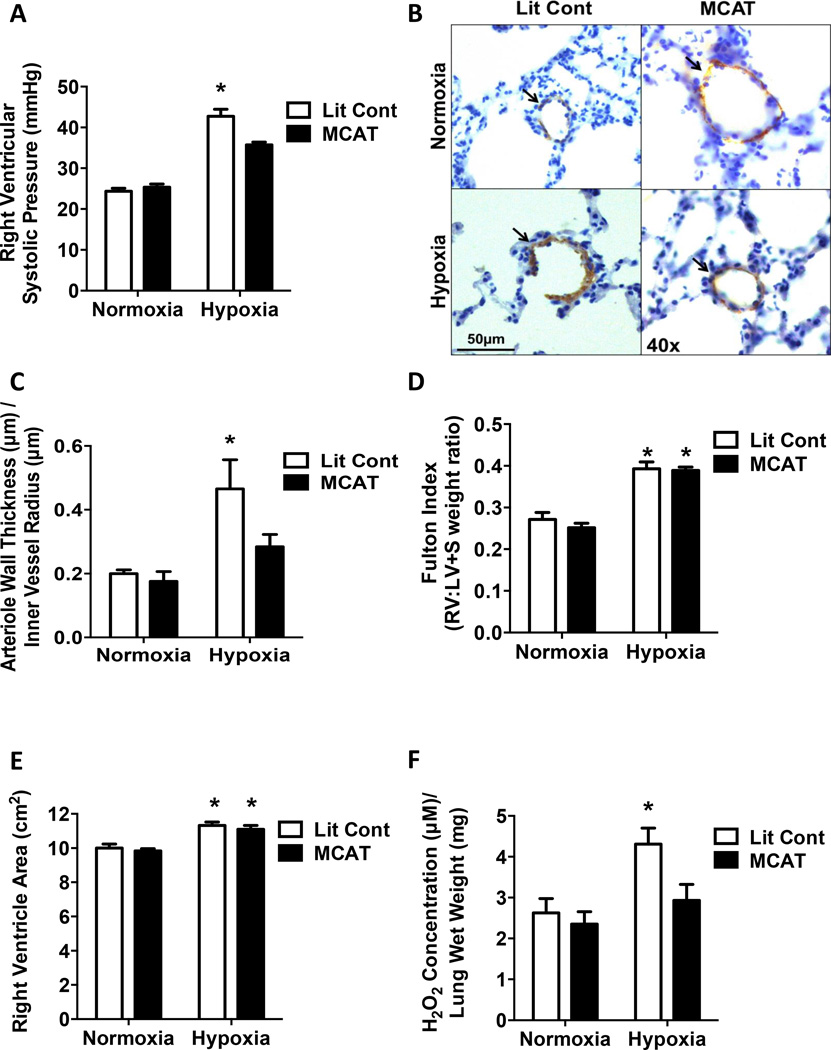
Figure 3. Mitochondrial-targeted catalase overexpression attenuates hypoxia-induced PH and muscularization of small pulmonary arteries.
Littermate control (Lit Cont) and MCAT mice were exposed normoxia (21% O2) or hypoxia (10% O2) for 3-weeks in 3 separate studies. (A) Right ventricular systolic pressure (RVSP) was recorded with a pressure transducer. MCAT expression able to prevent hypoxia-induced elevations in RVSP. Each bar represents mean ± SEM RVSP in mmHg (n = 10), *p < 0.05 compared to all other groups. (B) Lung sections (5 µm thick) were stained with α-SMA. Representative images are displayed as indicated. Brown staining indicated by arrows represents α-SMA positive staining in the media of small pulmonary arterioles. Magnification = 40×. (C) The wall thickness calculated by dividing total thickness of vessel by inner vessel radius. MCAT expression able to prevent hypoxia-induced elevations in α-SMA staining of small arterioles (n = 3 – 4), *p < 0.05 compared to all other groups. (D) Right ventricular hypertrophy was assessed by dissecting and weighing the right ventricle (RV) and the left ventricle + septum (LV + S) and calculating the RV:LV+S weight ratio. Hypoxia induces elevations in RVH. Each bar represents the mean ± SEM RV:LV+S weight ratio (n = 7 – 8), *p < 0.05 compared to both normoxia groups. (E) Right ventricular hypertrophy was also assessed by cardiac echocardiography and measurement of the right ventricular area. Each bar represents mean ± SEM RV area in cm2. Hypoxia increases right ventricular area (n = 7 – 8), *p < 0.05 compared to both normoxia groups. Amplex Red assay was utilized to assess lung extracellular H2O2 levels in lung tissue. (F) MCAT expression significantly decreased hypoxia-induced H2O2 production. Each bar represents mean ± SEM H2O2 concentration relative to lung tissue wet weight (n = 5 – 6), *p < 0.05 compared to all other groups.

