Figure 2.

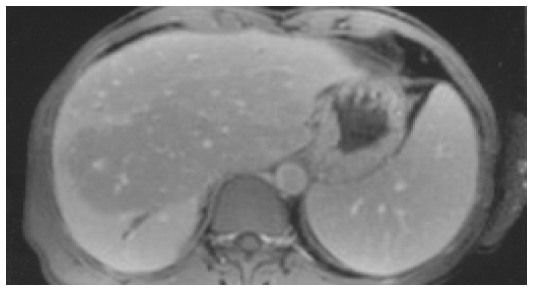
MRT of patient 2 (T1-weighted after contrast medium) showing an area centrally in the liver with reduced signal intensity, a dilatation of the bile duct in segment 6, and splenomegaly.

MRT of patient 2 (T1-weighted after contrast medium) showing an area centrally in the liver with reduced signal intensity, a dilatation of the bile duct in segment 6, and splenomegaly.