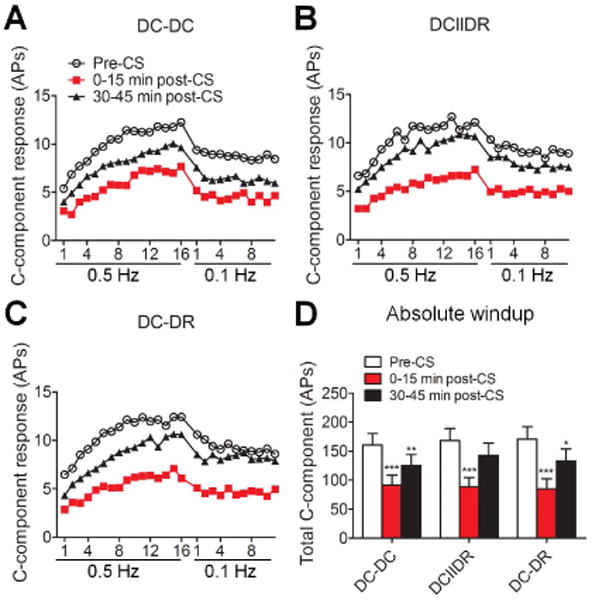
Figure 2.

Effects of different patterns of conditioning stimulation (CS) at moderate intensity on windup in SNL rats. (A-C) C-components of WDR neuronal responses to a train of electrical stimuli at a frequency of 0.5 Hz (16 pulses, 2.0 msec, 1.5 × C-threshold) and then at 0.1 Hz (12 pulses, applied 30 seconds after the cessation of 0.5-Hz stimulation) were plotted against the stimulation sequence number in each pattern group (DC-DC: n = 22; DCIIDR: n = 23; DC-DR: n = 22 neurons). For clarity, error bars are not shown. (D) The area under the windup function to a 0.5 Hz train pre-CS, 0-15 minutes post-CS, and 30-45 minutes post-CS at the moderate intensity of 50%(Ab0+Ab1) was compared between different pattern groups. Data are expressed as mean + SEM. *P<0.05, **P<0.01, ***P<0.001 as compared with the pre-CS baseline. AP: action potential, DC: dorsal column, DR: dorsal root.
