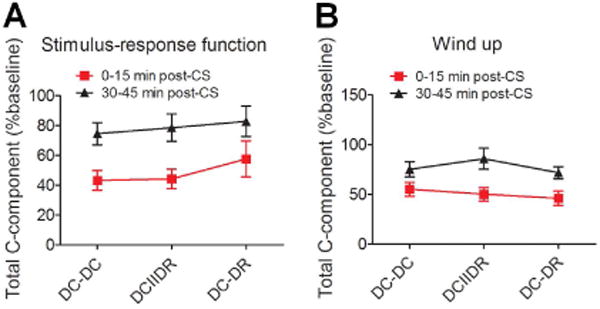
Figure 3.

Comparison of the inhibitory effects of the different patterns of conditioning stimulation (CS) at moderate intensity. (A) The total C-component of WDR neuronal response to graded electrical stimulation after CS at the moderate intensity of 50%(Ab0+Ab1) was normalized to the pre-CS baseline in each pattern group (DC-DC: n = 21; DCIIDR: n = 21; DC-DR: n = 20 neurons). (B) The areas under the windup function to a 0.5 Hz train after CS were also normalized to the baseline value in each pattern group (DC-DC: n = 22; DCIIDR: n = 23; DC-DR: n = 22 neurons). Data are expressed as mean ± SEM. DC: dorsal column, DR: dorsal root.
