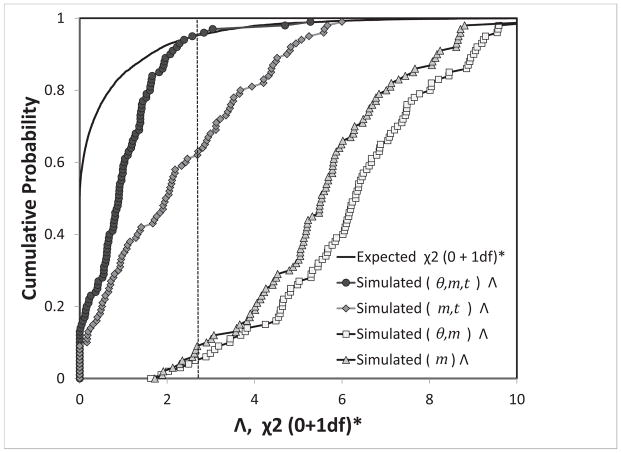
Figure 2.
The cumulative distribution of the likelihood ratio statistic. Shown are the theoretical expectation for the case with one model parameter fixed at a specific value (i.e. m = 0), and values estimated from histograms for 100 data sets under a three parameter model, as described in the text. Values of the cumulative distribution of Λ are shown for the full joint likelihood surface, and for marginal distributions where one or two model parameters are integrated out. The critical value for p = 0.05 is 2.71, and is shown as a vertical dotted line.

