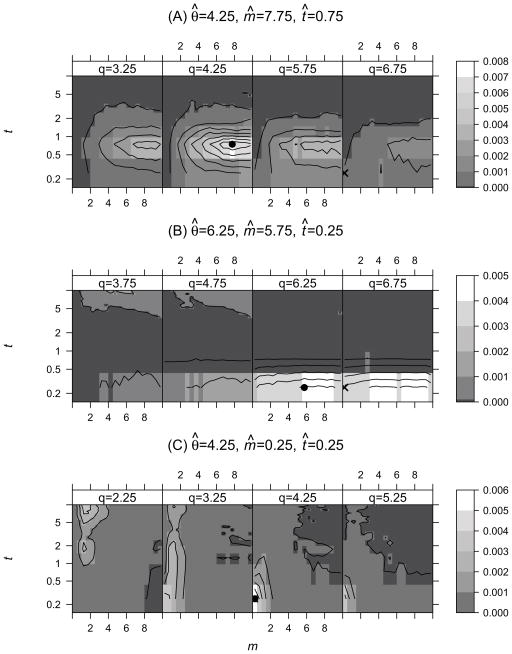
Figure 3.
Contour plots of p(θ, m, t|X) (proportional to the likelihood) for three representative data sets, with variation along the axis for θ shown as a series of four panels, each of which shows densities over m and t for a given value of θ. The Maximum likelihood estimate (MLE) under the null hypothesis (m = 0) is marked as × and the MLE under the alternative hypothesis is marked as ●. (A) A case where the null hypothesis was rejected (Λ = 5.27) and the MLEs under the two models differ considerably for all three parameters. (B) The MLE under the alternative model has a high estimate of the migration rate (m̄ = 5.75), however the null model is not rejected (Λ = 0.25). (C) The MLEs are the same for the two models (Λ = 0) and the null model is not rejected.

