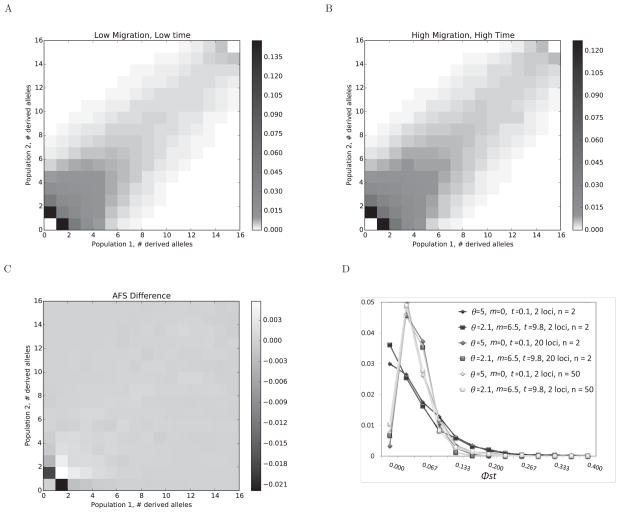
Figure 4.
Summary statistics for a data set that generates false positive results for tests of zero migration. A. The two population AFS based on 10,000 independent data sets, simulated for the true values: = 5, m = 0, t = 0.1. B. Simulated AFS under the estimated values: θ̂ = 2.1, m̂ = 6.5, t̂ = 9.8. C. The difference between the two AFSs. D. Histograms of Φst values for 1000 data sets simulated under true and estimated parameter sets for 2 or 20 loci, and for 15 or 50 gene copies sampled per population.

