
Figure 3.
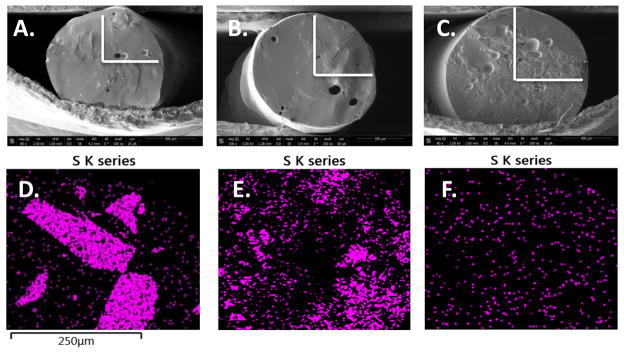
A–C: SEM micrographs. A. PLGA with native lysozyme, B. PLGA with native lysozyme and PEG6000 additive, and C. PLGA with PEGylated lysozyme with the region examined via EDX marked in white. D–F: EDX mapping of the sulfur peak for D. PLGA with native lysozyme, E. PLGA with native lysozyme and PEG6000 additive, and F. PLGA with PEGylated lysozyme.