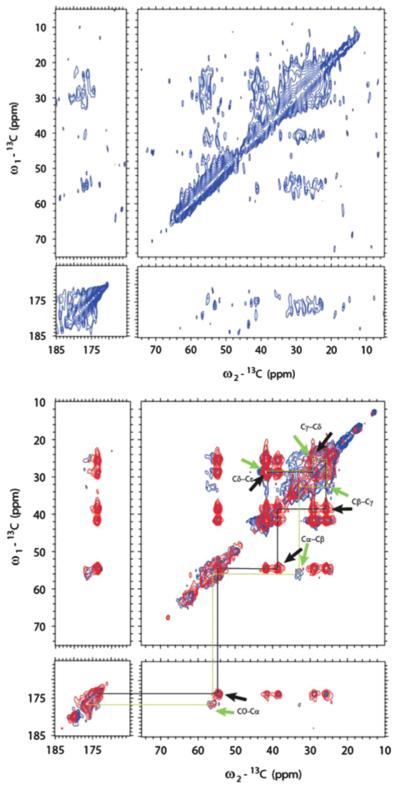
Fig. 10.
The 2D 13C–13C correlation spectrum of M180-K, using CP or DP, followed by DARR mixing: Top, in a nanosphere gel using CP, at −35 °C. The poor resolution and signal are all indicative of a highly mobile, unstructured protein. Bottom, bound to calcium phosphate crystals, at 37 °C. CP (red) and DP (blue). The black (β-strand) and green (random coil) traces are shown to distinguish the two structures. Reproduced with permission from Ref. [62]. Copyright 2013 Sage publications. (For interpretation of the references to color in this figure legend, the reader is referred to the web version of this article.)

