
Figure 2. Expression of microRNA and poly(A)RNA in miR-21 disrupted clones.
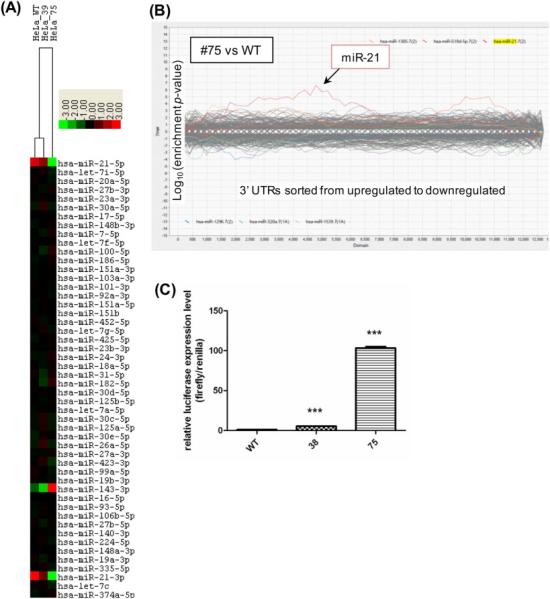
(A) A heatmap of the miR-Seq data from HeLa WT and disrupted clones #39 and #75. The 50 most abundant microRNAs were ranked and clustered by centering on the row-wise mean log(2) value [17]. A scale of 8-fold deviation from the mean is shown. (B) Sylamer analysis of gene expression changes. Poly(A) RNA was quantified by deep sequencing and the expression changes between miR-21 disrupted clones #75 and the WT were analyzed using Sylamer. Gene expression changes were ranked from increase to decrease (left to right) and enrichment p-value was determined for all possible 7-mers in the genes’ 3’UTR. Genes carrying a miR-21 target sequence, miR-21 7(2) or miR-21 7(1A), were over-represented in the up-regulated region in both cases. (C) Expression of a luciferase reporter with a miR-21 target sequence in clones #38 and #75. A miR-21 reporter plasmid carrying a firefly luciferase with 3 copies of the miR-21 complementary sequence and a control Renilla luciferase (our unpublished) was transfected into the cells. Luciferase activity was determined 48 h after transfection and normalized to the level detected in the WT cells; *** represents a significant difference in luciferase reporter expression with p≤0.001.