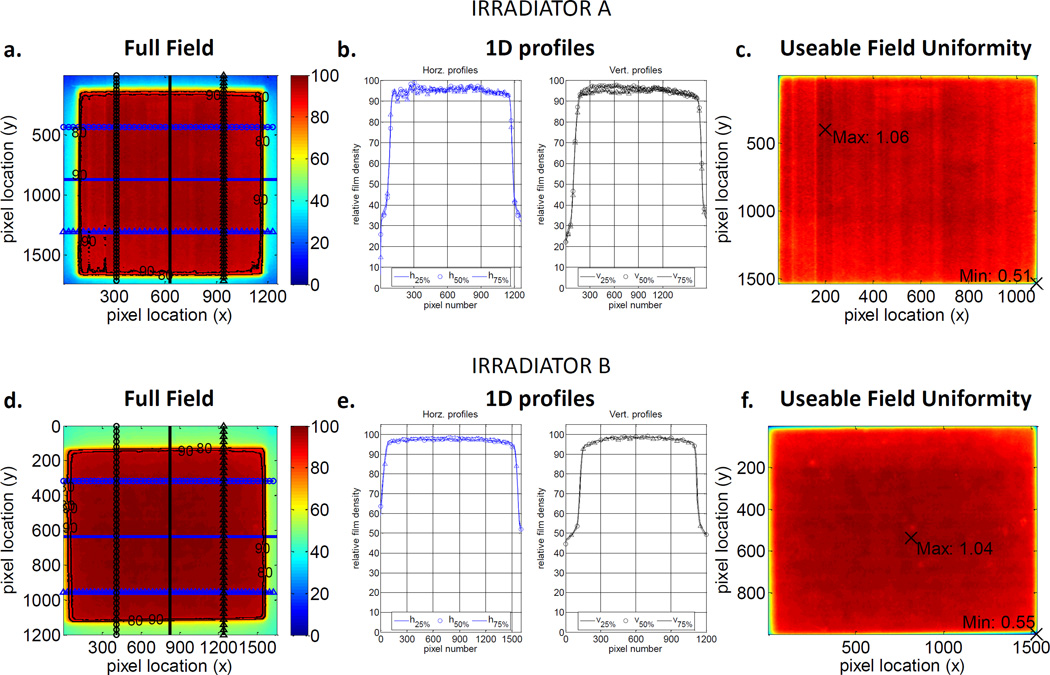
Figure 3.
Field uniformity results for Irradiator A (A–C) and Irradiator B (D–F) XRAD-320 kilovoltage irradiators. Images A and D represent pixel values of the whole field normalized to the maximum pixel value. B and D are 1D profiles 25%, 50% and 75% across this normalized field in the horizontal and vertical directions. C and F show the variation in pixel values within the useable field normalized to the mean value.

