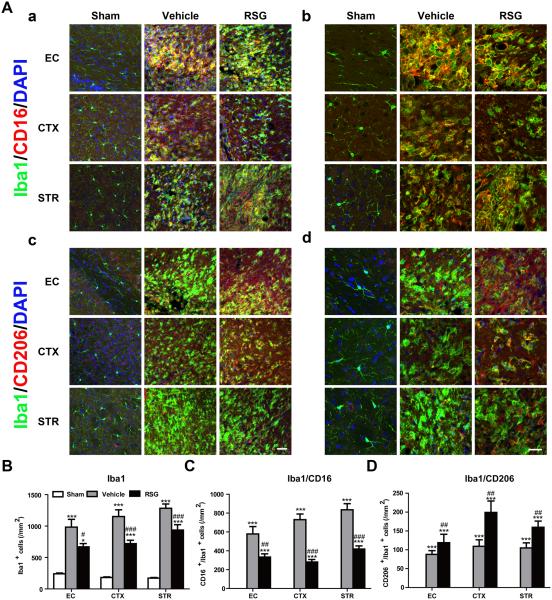
Figure 5. Rosiglitazone Drives M2 Microglial Polarization after MCAO.
A, Representative images of Iba1 (green), CD16 (red, a,b), and CD206 (red, c,d) immunostaining 21 days after cerebral ischemia in ipsilateral external capsule (EC), cortex (CTX), and striatum (STR). Scale bar in a, c = 100 μm. Scale bar in b, d = 30 μm. B-D, Numbers of Iba1-positive microglia (B), Iba1/CD16-dual labeled M1 microglia (C) and Iba1/CD206-dual labeled M2 microglia (D) were quantified and expressed as cells / mm2. Data are expressed as mean ± SEM. N=8-10 per group. * P ≤ 0.05, *** P ≤ 0.001 vs sham, # P ≤ 0.05, ## P ≤ 0.01, ### P ≤ 0.001 vs vehicle.

