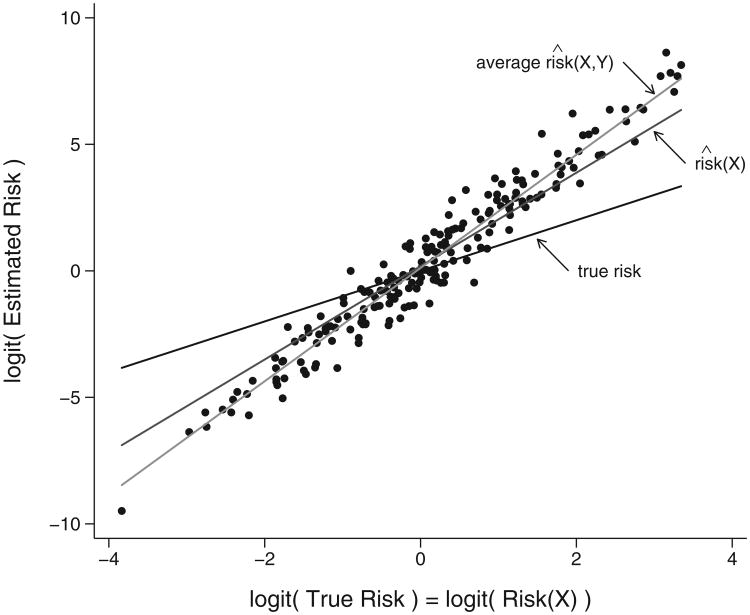
Fig. 1.
Risk estimates calculated using models fit to training data, and applied to a test data set of 5000 observations. Data were simulated from the scenario shown in the second to last row of Table 1. Shown are results for one simulation in which values of performance improvement statistics are: NRI= 56.21%, ΔROC(0.2) = −1.48%, ΔAUC= −0.59%, ΔBrier= −1.10% and ΔSNB(ρ) = −1.49%. A random sample of 200 test set estimates, riŝk(X,Y), are shown, as well as a line fit to all 5000 values. The baseline fitted model, logit riŝk(X), is linear in X and the true risk, risk(X) is the 45° line.

