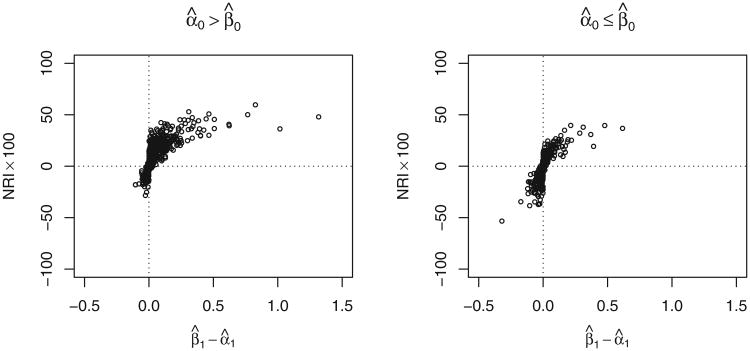
Fig. 2.
Scatterplots showing the relationship between the NRI statistic (× 100) and β̂1–α̂1 in 1000 simulated datasets generated according to the scenario shown in the second to last row of Table 1. The coefficients are calculated by fitting the models logit P(D = 1|X) = α0 + α1X and logit P(D = 1|X, Y) = β0 + β1X + β2Y to the training data. The NRI is calculated using the test dataset.

