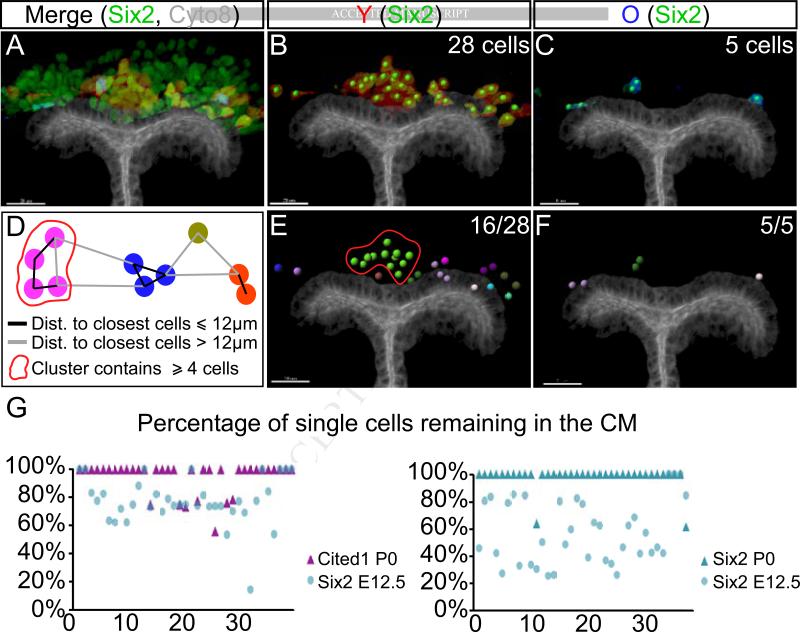
Figure 4. Old cells remaining in the niche are surrounded by young neighbors.
(A-C) A representative example of the Imaris software analysis pipeline. Antibody staining labels CM (Six2, green) and UB (Cyto8, white); injected E12.5 tdTomato+ cells are red and P0 CFP+ cells are blue. Six2+ nuclei that are positive for either tdTomato (B) or CFP (C) are marked with bright green dots. (D) Criteria for segregating clusters; see text for detail. (E-F) Counting the number of “single” cells in this niche. 16 out of 28 young cells were single or in small (>4 cell) clusters, whereas 5 out of 5 old cells were single. (G) Quantification of the percentage of “single” Six2+ and Cited1+ cells to total cells by the end of 4-day culture in 37 injected niches (distance to closest cells ≤12μm). See also Figure S3 and Table S1.

