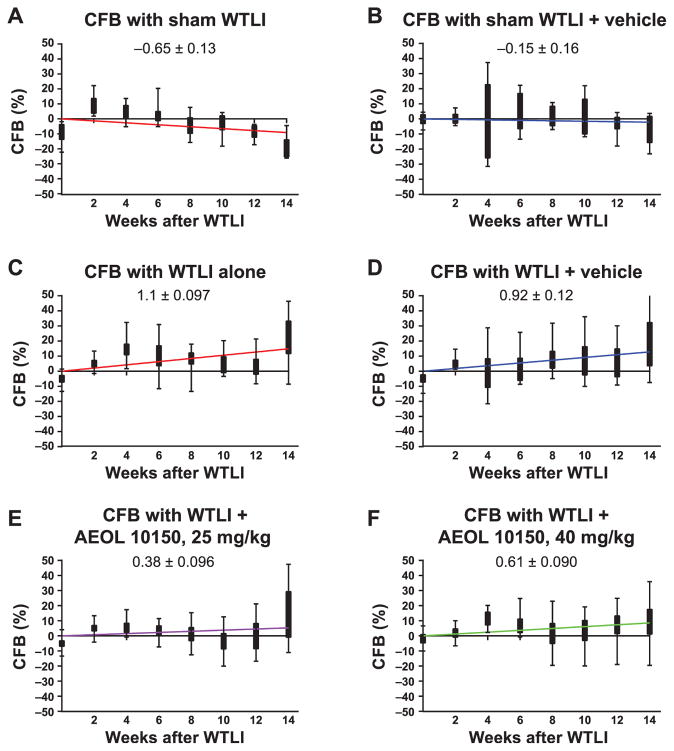
FIG. 4.
Change in respiratory frequency from baseline (CFB) using the average of TRF at day 0 and 14 (two weeks) as baseline. A linear regression was performed to get an estimation of the slope (labeled in each graph), which indicates the relative change in frequency over time. Since the animals died after week 14 only the data from the first 14 weeks in each study group were analyzed. All the sham groups have the slope <0.1 (panel A), which indicates a consistent breathing pattern in the nonirradiated mice, with a shift towards zero with addition of vehicle (panel B). Among the irradiated groups, the slope of the CFB is highest for the WTLI-alone group (panel C) and WTLI-vehicle groups (panel D). Use of AEOL 10150 shows a shift in the trend back towards zero as the drug dose is increased, as with WTLI-AEOL 10150, 25 mg/kg (panel E) and WTLI-AEOL 10150, 40 mg/kg (panel F), suggesting a trend towards maintenance of a baseline breathing pattern despite the radiation exposure.

