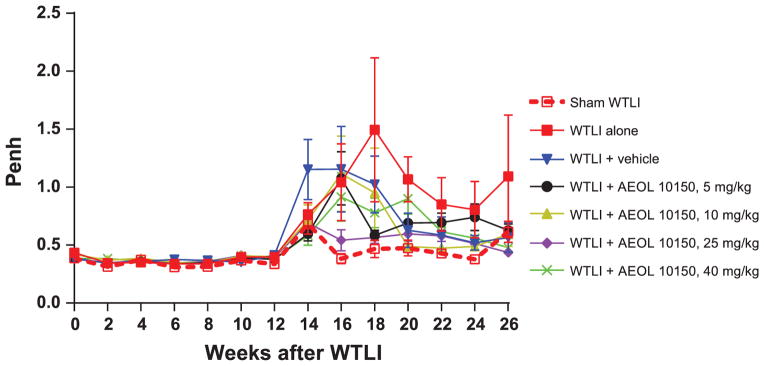
FIG. 5.

Penh in WTLI (14.6 Gy) and sham-irradiated (0 Gy) WTLI groups. Error bar represents the SEM in the group. On and after week 14 postirradiation, all WTLI groups have a higher Penh than the representative sham-irradiated groups. In the treatment groups from weeks 14–26, the WTLI-AEOL 10150, 10 mg/kg and WTLI-AEOL 10150, 25 mg/kg groups have lower Penh than the WTLI-AEOL 10150, 5 mg/kg and WTLI-AEOL 10150, 40 mg/kg groups. The following comparisons were statistically significant: WTLI vs. WTLI-AEOL 10150, 25 mg/kg, week 16 and 18, P = 0.044 and 0.025, respectively; WTLI-vehicle vs. WTLI-AEOL 10150, 25 mg/kg, week 16 and 18, P = 0.056 and 0.030, respectively; WTLI-AEOL 10150, 5 mg/kg vs. WTLI-AEOL 10150, 25 mg/kg, week 16, P = 0.028; WTLI-AEOL 10150, 10 mg/kg vs. WTLI-AEOL 10150, 25 mg/kg, week 16, P = 0.065; WTLI-AEOL 10150, 40 mg/kg vs. WTLI-AEOL 10150, 25 mg/kg, week 16, P = 0.006.
