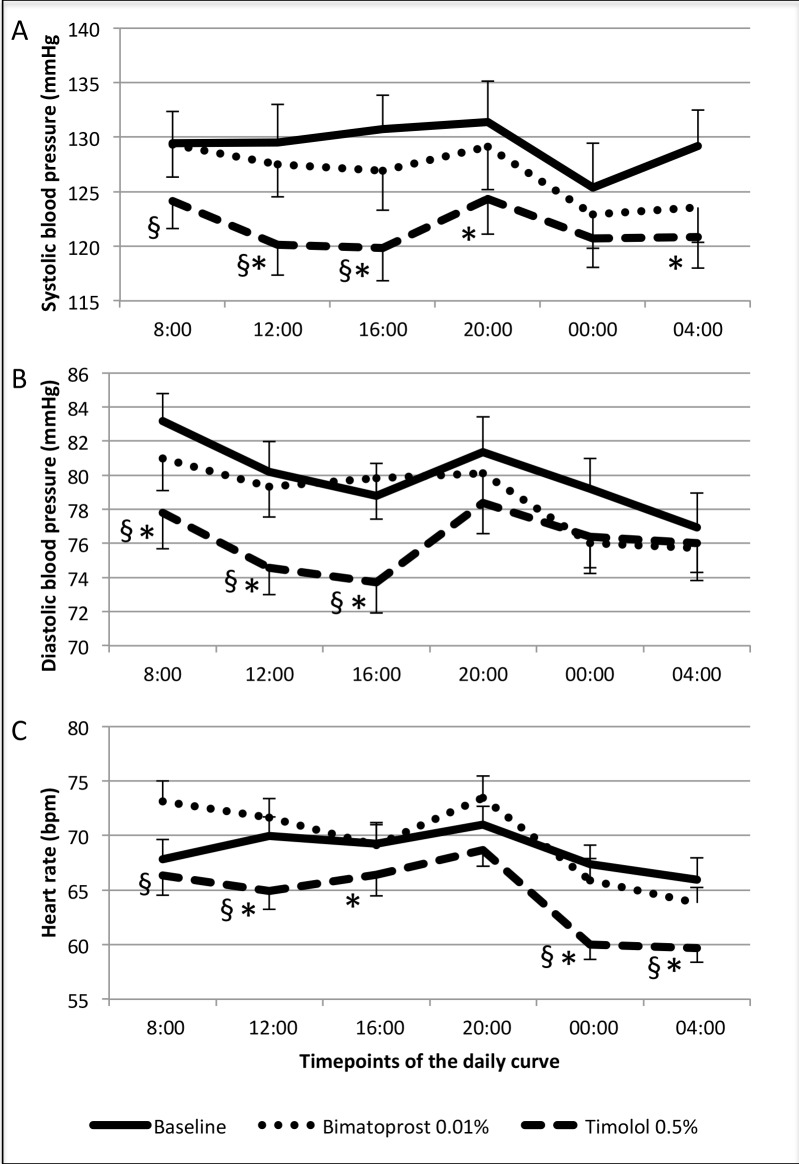
Fig 3. Systolic (A) and diastolic (B) blood pressure and heart rate (C) at each timepoint of the 24h curve at baseline (continuous line), during timolol 0.5% bid (dashed line) and during bimatoprost 0.01% plus placebo treatment (dotted line).
Bpm = beats per minute. Error bars represents standard error; * = p<5% for timepoint comparison versus baseline; § = p<5% for timepoint comparison between timolol 0.5% bid and bimatoprost 0.01% plus placebo.

