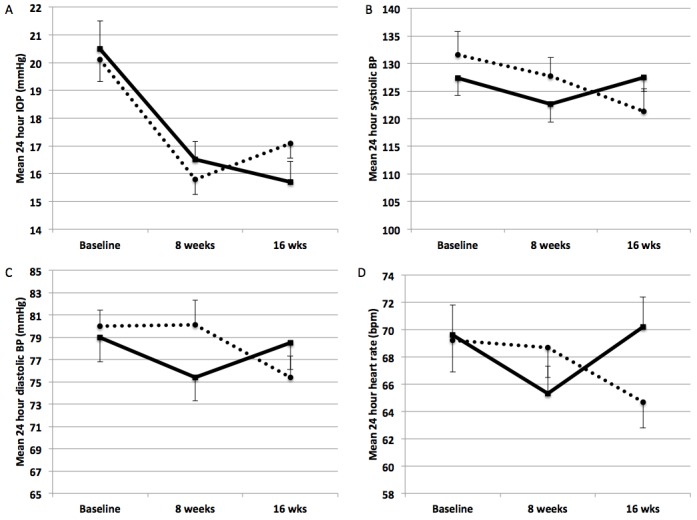
Fig 4. Display of the mean 24 hour IOP (A), systolic BP (B), diastolic BP (C) and heart rate (D) of the two arms of the study at baseline, at 8 weeks before the crossover and at 16 weeks after the crossover.

The dotted line indicates the study arm that received bimatoprost 0.01% plus placebo as first treatment and timolol 0.5% bid as second treatment. The continous line indicates the study arm that received timolol 0.5% bid as first treatment and bimatoprost 0.01% plus placebo as second treatment. IOP = intraocular pressure, BP = blood pressure.
