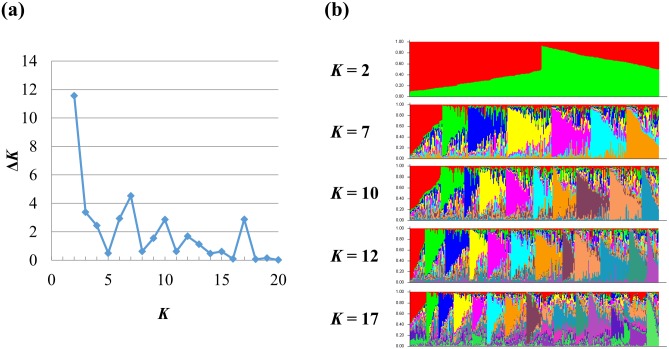
Fig 2. Estimated Phellinus noxius population structure in Taiwan by Bayesian genetic clustering analysis.
K is the number of genetic clusters assumed. (a) The delta K plot shows multiple peaks. (b) STRUCTURE bar plot at K = 2, 3, 5, and 7. Each bar represents an individual P. noxius isolate. The colors represent different genetic clusters, and the lengths of the colored segments in a bar represent the estimated membership proportions of that individual to each cluster.

