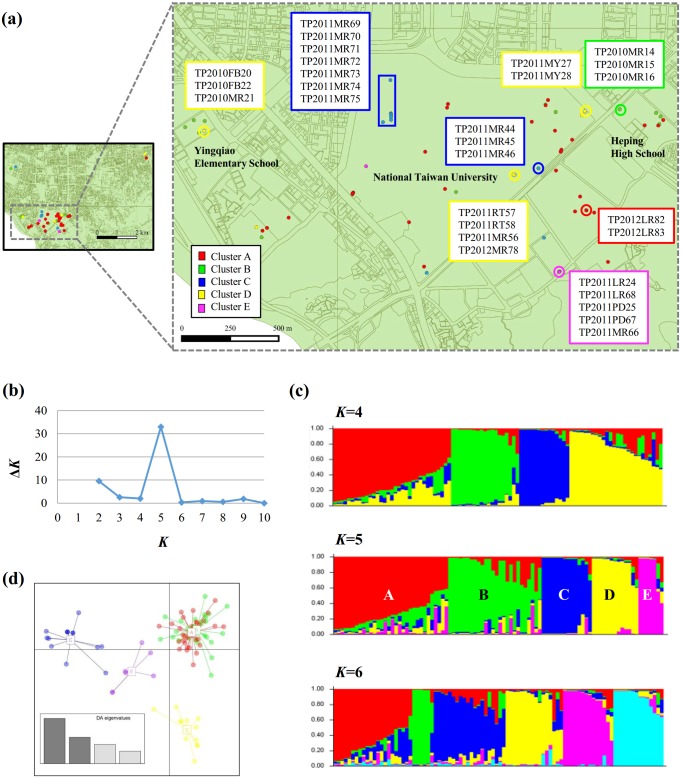
Fig 3. Estimated Phellinus noxius population structure in Taipei by Bayesian genetic clustering analysis.
(a) Map of the collection sites in Taipei (left: the 7 x 4 km2 area containing 92 isolates; right: the 3 x 1.2 km2 area containing 85 isolates). Dots in different colors represent P. noxius isolates of different genetic clusters. The isolates grouped in boxes are genetically highly similar. (b) The delta K plot shows a clear peak at the optimal value of K = 5. K is the number of genetic clusters assumed. (c) STRUCTURE bar plot at K = 4, 5, and 6. Each bar represents an individual P. noxius isolate. The colors represent different genetic clusters, and the lengths of the colored segments in a bar represent the estimated membership proportions of that individual to each cluster. (d) Discriminant analysis of principal components (DAPC) for the five presumed clusters inferred by STRUCTURE analysis. The scatterplot shows only the first two principle components (PCs) accounting for 80% of the total variance. DAPC eigenvalues are illustrated in the enclosed barplot.

