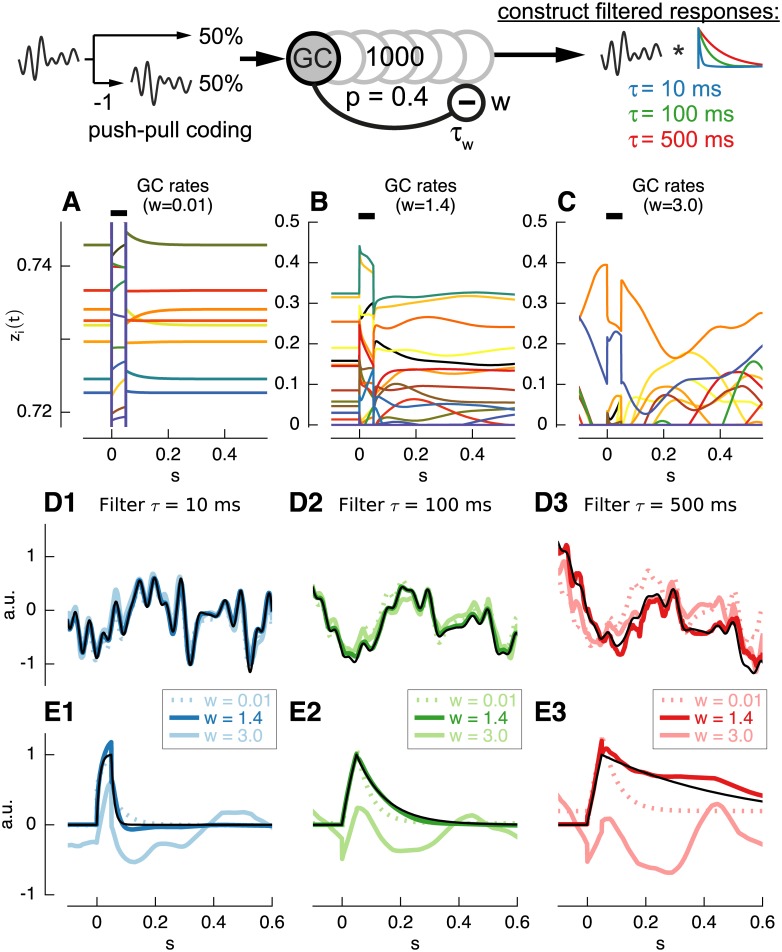
Fig 2. Responses of constructed filters and individual granule cell rates.
A,B,C: Individual responses of randomly selected granule cells with weights w = 0.01 (A), w = 1.4 (B), w = 3 (C). Black bars indicate duration of pulse input. D,E: Responses of filters (τ 1 = 10ms (D1,E1), τ 2 = 100ms (D2,E2) and τ 3 = 500ms (D3,E3)) constructed from network with inhibitory time constant τ w = 50ms and inhibitory weight w = 1.4 (blue, green and red lines), w = 3 (light blue, light green and light red lines) or w = 0.01 (dotted light blue, light green and light red lines) to colored noise input (D) or pulse input (E). Responses of corresponding ideal filters shown as black lines. To construct the shown filters of 10/100/500ms the percentage of weights equal 0 and mean absolute weights > 0 was 90/53/34% and 20.6/60.4/86.1 for w = 0.01, 76/70/65% and 4.2/13.6/26.5 for w = 3 and 91/86/75% and 5.5/11.7/52.6 for w = 1.4, respectively.

