
Figure 4.
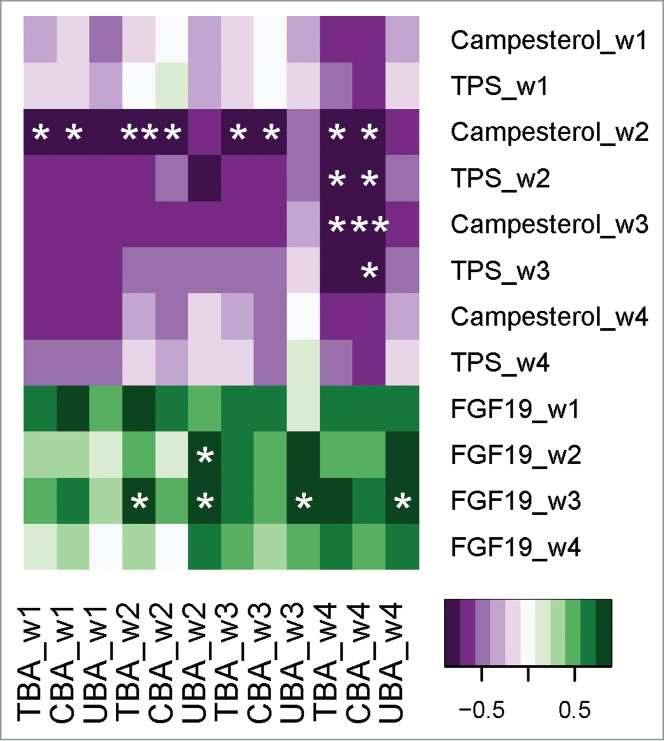
Heat map visualization of changes in bile acids over the 4-week dose escalation period and associations with changes in FGF-19 and plant sterols in otherwise healthy hypercholesterolemic subjects consuming L. reuteri NCIMB 30242. Changes in total bile acids (TBA), conjugated bile acids (CBA) and unconjugated bile acids (UBA) are ordered on the x-axis while changes in campesterol, total plant sterols (TPS) and FGF-19 are ordered on the y-axis. Significant positive or negative associations (*P < 0.05, **P < 0.01).