
Figure 4.
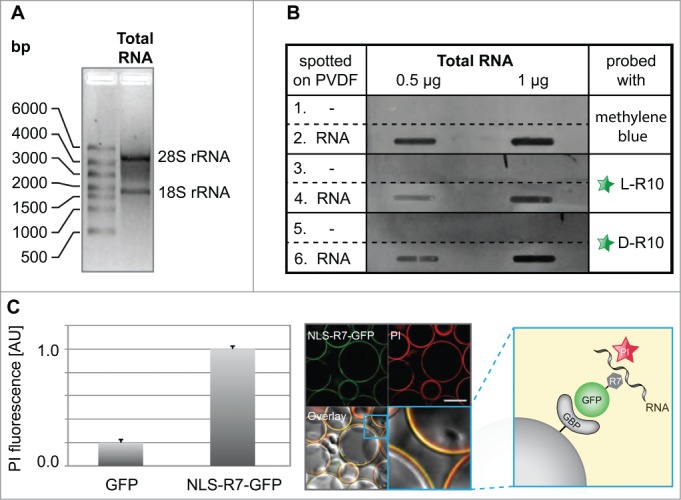
Analyses of RNA binding to poly-(R)peptides and GFP fusions. (A) Total RNA used for in vitro RNA binding assays separated by size showing the absence of genomic DNA contamination, as well as characteristic bands for the 28S and 18S rRNA, which are primarily synthesized and localized in nucleoli. The slot blot in (B) (representative from 2 independent experiments), rows 1 and 2, show a methylene blue stained PDVF membrane in the absence (1) and presence (2) of different amounts of total RNA (0.5 µg and 1 µg) and were used as a loading control. The rest of the blot shows the binding of fluorescently tagged L-R10 (3 and 4) and D-R10 (5 and 6) in the absence (3 and 5) and presence (4 and 6) of total RNA. Slots lacking RNA (rows 5 and 6) do not show binding of L- and D-R10, respectively. In contrast, slots probed with increasing amounts of RNA show increasing L- and D-R10 binding. (C) In vitro RNA pulldown assay using NLS-R7-GFP immobilized to sepharose beads via the GFP binding protein (GBP) (scheme). RNA was stained using propidium iodide (PI) and GFP alone was used as a negative control. RNA binding was measured on a fluorescent plate reader (bar plot) and imaged by confocal microscopy (microscopic images). Plots represent the average plus standard deviation of 2 independent experiments. Scalebar: 100 µm.