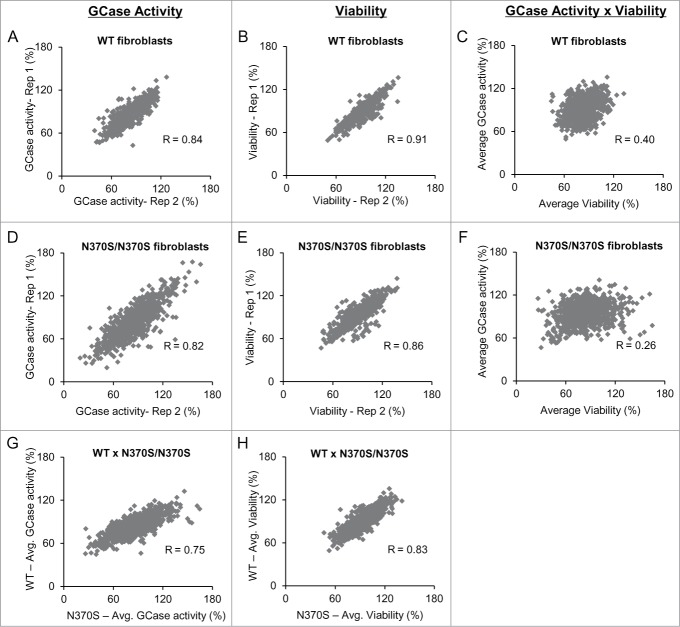
Figure 2.
Primary screening data showed consistent results between replicates and different cell lines. Replicates of GCase activity (A and D) and viability (B and E) signal measured in WT and N370S/N370S cells, respectively. Correlation between GCase activity and viability in WT (C) and N370S/N370S (F) fibroblasts showed that the signal was impacted by cell viability. Comparison of the results of enzyme activity (G) and viability (H) in both cell types. All data is represented as % negative control siRNA.

