
Figure 5.
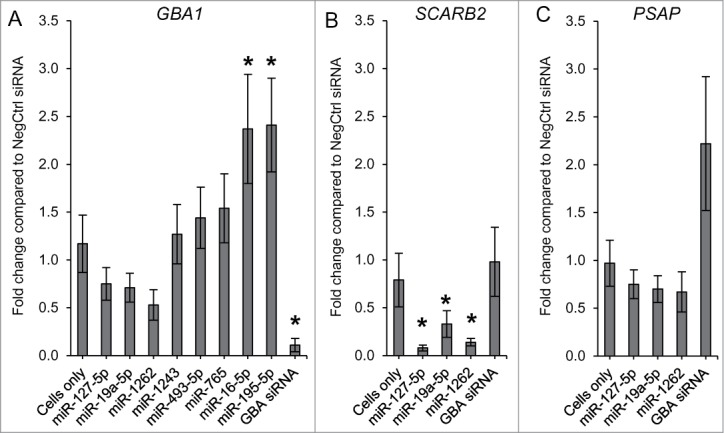
mRNA expression profiles evaluated in N370S/N370S fibroblasts after a 72 hour transfection with selected miRNAs that down- and up-regulated GCase activity. GBA1 (A), SCARB2 (B) and PSAP (C) levels were analyzed by real-time PCR. Error bars represent 95% of confidence intervals (CI). *Indicates p-value < 0.001 compared to NegCtrl siRNA.