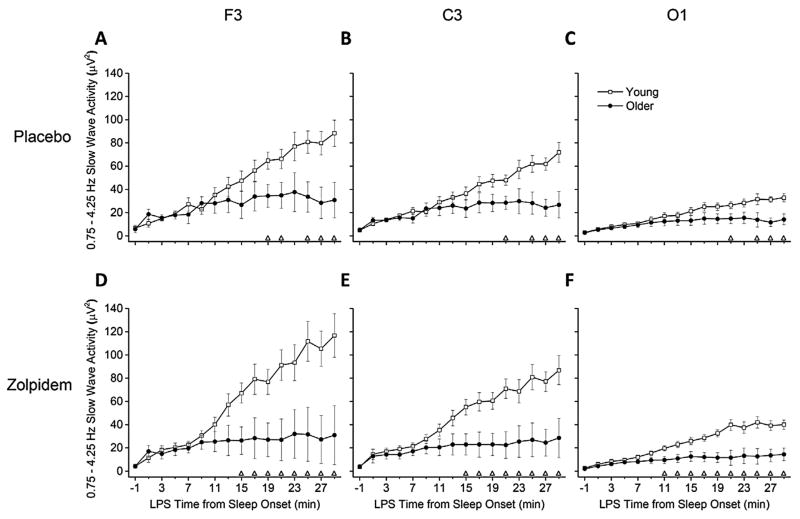
Fig. 2.
SWA Rise Time from LPS between Age Groups – Absolute SWA Power. Data presented are absolute slow wave activity (SWA) power in 2-min time bins, lasting from the 2 min preceding until the 30 min after latency to persistent sleep (LPS). Plot details are same as Fig. 1. Young n = 11, older n = 6. Condition-brain region combinations shown are (A) Placebo-F3, (B) Placebo-C3, (C) Placebo-O1, (D) Zolpidem-F3, (E) Zolpidem-C3, and (F) Zolpidem-O1.

