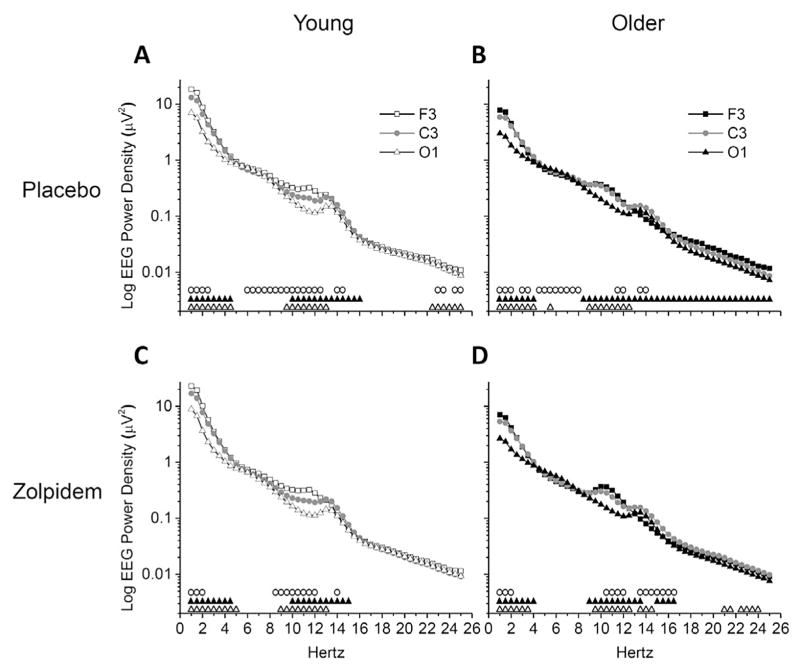
Fig. 4.
NREM EEG Power Spectra between Brain Regions – Absolute Power. Data presented are absolute EEG power spectra for average of NREM sleep epochs occurring after sleep onset latency (SOL) in the 110-min sleep opportunity. Power spectra were calculated in half-Hertz frequency bins between 0.75 and 25.25 Hz and are plotted at the centers of the corresponding half-Hertz bins. Mean values are expressed for F3, C3, and O1 brain regions, and presented on log scales separately for placebo and zolpidem condition and young and older age group combinations. Symbols above abscissa denote significant differences comparing between brain region pairs (open circles (○) = F3 vs. C3, black triangles (▲) = C3 vs. O1, open triangles (△) = F3 vs. O1) at corresponding frequency bins, calculated with dependent t-tests and alpha level of p < 0.05. Young n = 12, older n = 11. Condition-age group combinations shown are (A) Placebo-Young, (B) Placebo-Older, (C) Zolpidem-Young, and (D) Zolpidem-Older.

