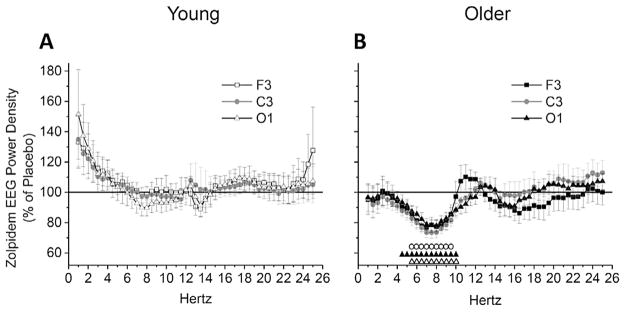
Fig. 5.

NREM EEG Power Spectra between Conditions – Percent of Placebo. Data presented are zolpidem condition NREM EEG power spectra expressed as a percent of placebo condition for average of NREM sleep epochs occurring after sleep onset latency (SOL) in the 110-min sleep opportunity. Power spectra were calculated in half-Hertz frequency bins between 0.75 and 25.25 Hz and are plotted at the centers of the corresponding half-Hertz bins. Values are expressed as mean ± standard error of the mean (SEM) for F3, C3, and O1 brain regions, and presented separately for young (A) and older (B) adult age groups. Symbols above abscissa denote significant differences between placebo (horizontal 100% line) and zolpidem conditions for individual brain regions (open circles (○) = F3, black triangles (▲) = C3, open triangles (△) = O1) at corresponding frequency bins, calculated with single-sample t-tests and alpha level of p < 0.05. Young n = 12, older n = 11.
