
Figure 3. Experimental validation of representative lipid probe targets.
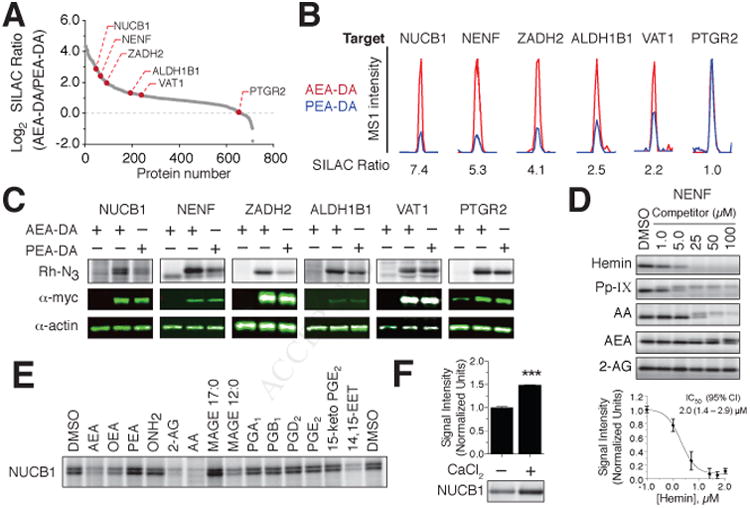
(A) SILAC ratio plot for AEA-DA versus PEA-DA (20 μM) probe labeling in HEK293T cells highlighting targets selected for experimental validation.
(B) Representative peptide MS1 chromatograms for selected targets showing relative labeling by AEA-DA and PEA-DA probes.
(C) Lipid probe labeling of myc-tagged recombinant proteins expressed by transient transfection in HEK293T cells. Top panels show in situ labeling profiles for the AEA-DA and PEA-DA probes with indicated targets (lane 1, mock-transfected cells; lanes 2 & 3, target-transfected cells; see Figure S3A for full gel profiles). Middle panels, anti-myc blotting. Lower panels, anti-actin blotting as a loading control.
(D) Upper panel shows in vitro competition profiles of AEA-DA probe labeling of NENF by hemin, protoporphyrin IX (Pp-IX), and the arachidonoyl lipids AA, AEA and 2-AG (1–100 μM) (experiments performed in NENF-transfected HEK293T lysates). Lower panel shows concentration-dependent inhibition of AEA-DA labeling of NENF by hemin (CI = 95% confidence interval) as determined from gel profiles. Data represent mean values ± SD from three independent experiments.
(E) In vitro competition profiles of NUCB1 labeling by the AEA-DA (5.0 μM) probe using variouslipids (20×) as competitors. Experiments were performed in lysates from NUCB1-transfectedHEK293T cells.
(F) Calcium-dependent enhancement of NUCB1 labeling by the AEA-DA probe. Data represent mean values ± SEM; n = 3/condition. ***P < 0.001 for untreated versus CaCl2 (100 μM)-treated samples.