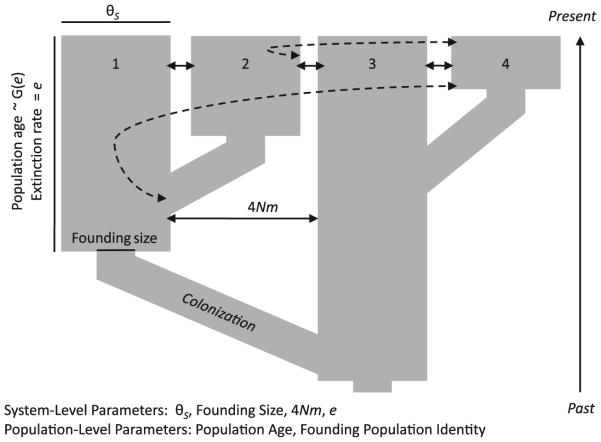
Fig. 1.
Graphical representation of the simulated coalescent model, with four populations instead of the 14 considered in our analysis. Subpopulation effective sizes (width of population bars), pairwise migration rates (solid and dotted arrows), and founding population sizes (width of small boxes in the history of each population) were constrained to be equal across the system. The model illustrated corresponds to the strict metapopulation model or the variable e model, as all patches were recolonized in the recent past.

