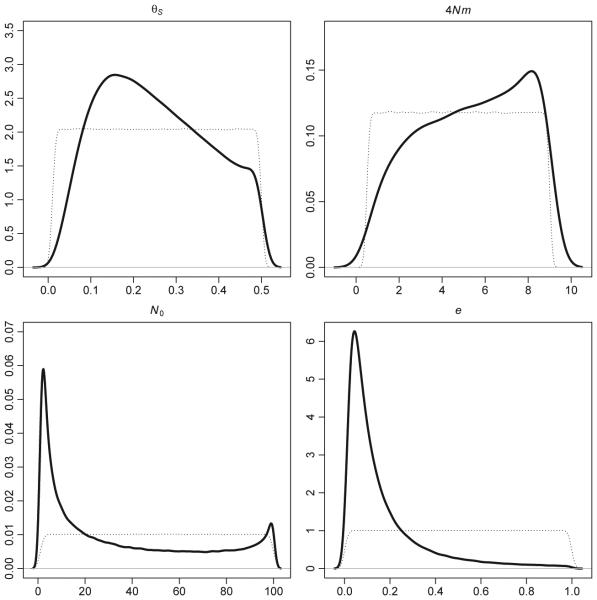
Fig. 2.
Prior (dotted lines) and posterior distributions (solid lines) estimated for the four parameters of the persistent source model. Estimates are from an ABC analysis considering only the data sets simulated with a persistent source population and using the neural net methodology with a tolerance of 25% (250 000 data sets).

