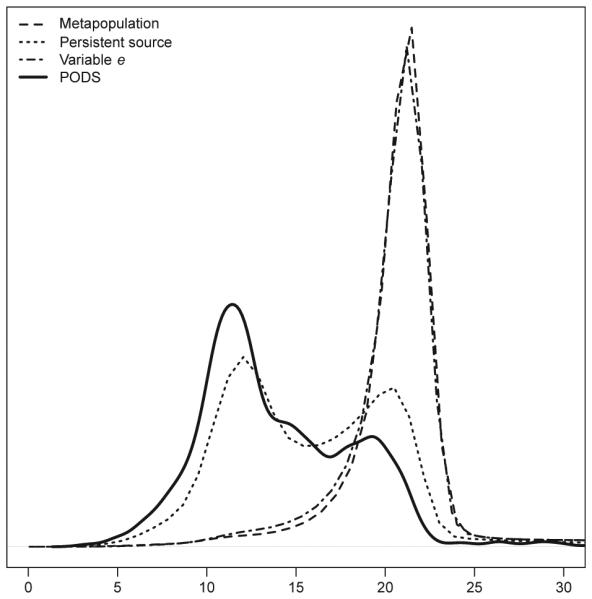
Fig. 3.

Euclidean distances between standardized summary statistics from simulated and observed data. Distances for simulations conducted under a strict metapopulation model (dashed line; n = 1,000,000), a persistent source model (dotted line; n = 1,000,000), a model that allowed among population variation in extinction rate (dot-dashed line; n = 1,000,000), and pseudo-observed data sets (PODS) simulated under the persistent source model with parameter values drawn from posterior distributions (heavy solid line; n = 1000) are shown.
