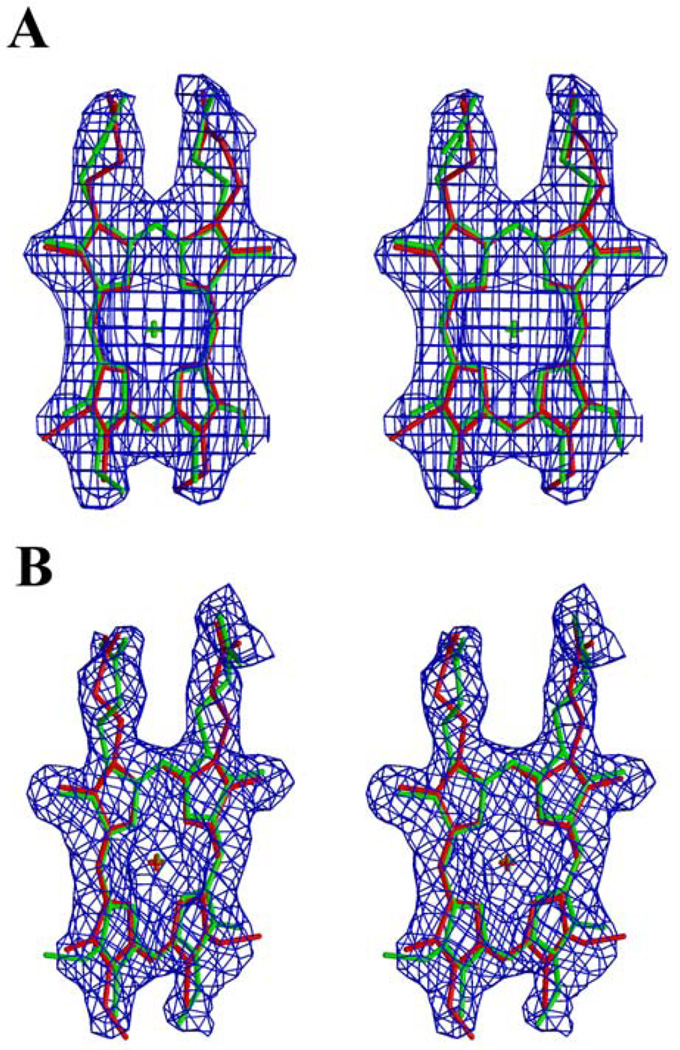
Figure 6.
stereoview of the two positions of the heme situated on the 2-fold crystallographic axis (a) and on the 2-fold noncrystallographic axis (b) in a 3Fo-2Fc omit map calculated at 2.6 Å resolution and contoured at 1.2 □. The two orientations of the heme are showed in green and red colors. For (a) the map was calculated from data reduced in the space group I4 to avoid imposing symmetry, and in both figures the heme was omitted from the phasing model. The drawing was generated using Molscript (19) and O (16) and rendered using Raster3D (20).

