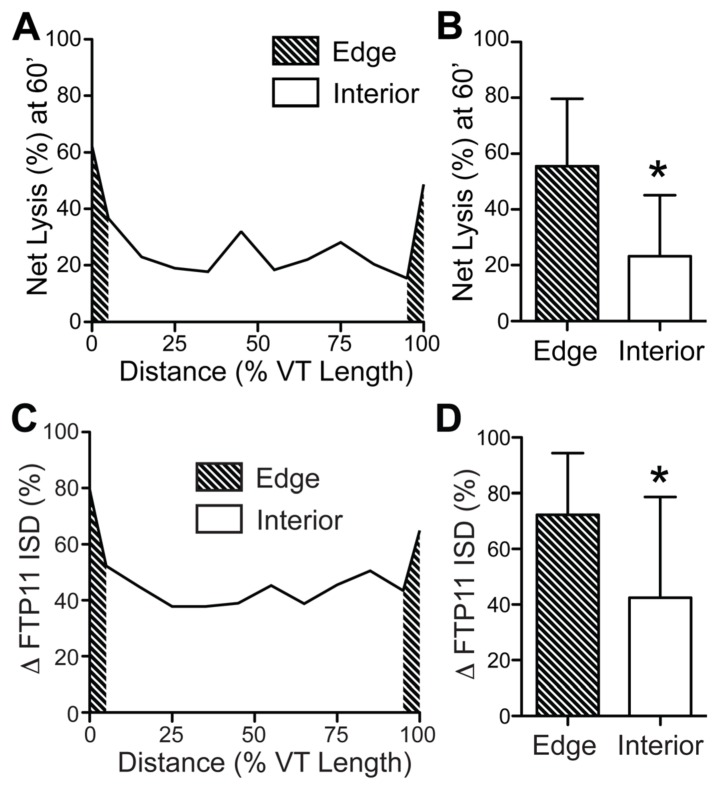
Figure 7.
Augmented fibrinolysis occurs at the thrombus edges, as compared to the thrombus interior, in day 1 VT. (A, B) Line-by-line IVM image analysis of the net fibrinolysis shows a significant increase in fibrinolysis at the proximal and distal edges (shaded area), as compared to the thrombus interior. (C, D) Line-by-line IVM image analysis also demonstrates significantly greater FTP11 signal reduction (change in FTP11 ISD) occurs at the thrombus edges (shaded area), as compared to the thrombus interior. The proximal and distal edges were pooled for the graphs in (B) and (D). ISD, integrated signal density. *p<0.05.

