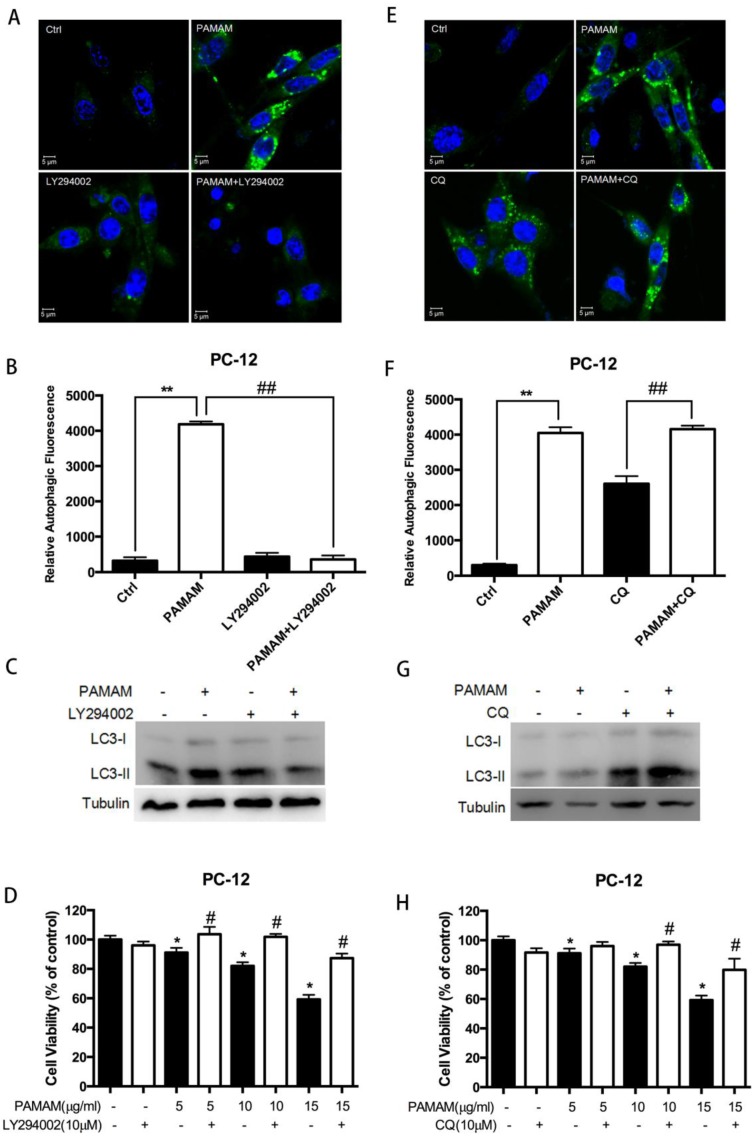
Figure 5.
Inhibition of autophagy protected against PAMAM dendrimers-induced neuronal cell death. (A) PC-12 cells were incubated with or without PAMAM dendrimers in the presence or absence of the autophagy inhibitor LY294002 for 24 h. Cell samples were stained with Cyto-ID Green dye and analyzed by confocal microscopy. Untreated cells were used as negative control. (B) The relative autophagic fluorescence intensity was quantified by confocal microscopy software. All data were presented as the means ± SD of more than three samples. (C) PC-12 cells were treated as described in (A). The whole protein was extracted, and LC3 was analyzed by Western blot. (D) PC-12 cells were treated as was described in (A). Cell growth inhibition was analyzed by CCK-8. All data were presented as the means ± SD of four samples. *p<0.05 versus Ctrl, and #p<0.05 versus PAMAM dendrimers G5-treated group. (E) PC-12 cells were incubated with or without PAMAM dendrimers in the presence or absence of the autophagy inhibitor CQ for 24 h. Cell samples were stained with Cyto-ID Green autophagy dye and analyzed by confocal microscopy. Untreated cells were used as negative control. (F) The relative autophagic fluorescence intensity was quantified by confocal microscopy software. All data were presented as the means ± SD of more than three samples. (G) PC-12 cells were treated as was described in (E). The whole protein was extracted, and LC3 was analyzed by Western blot. (H) PC-12 cells were treated as was described in (E). Cell growth inhibition was analyzed by CCK-8. All data were presented as the means ± SD of four samples. *p<0.05 versus Ctrl, and #p<0.05 versus PAMAM dendrimers G5-treated group.

