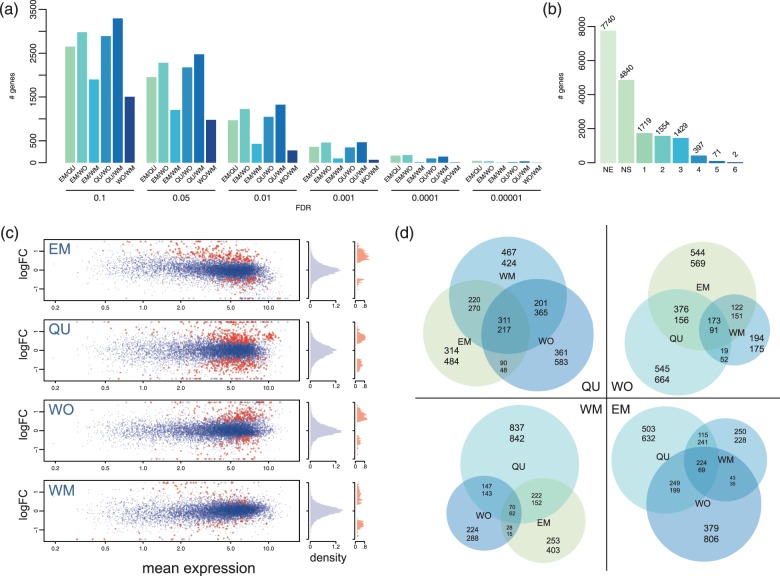
Fig. 3.
(a) Number of differentially expressed genes for the six possible pairwise comparisons at different FDR cutoffs. (b) Summary of differential gene expression calls with six pairwise comparisons at an FDR of 0.05, NE, not expressed; NS, no significant difference in expression; 1–6; Number of genes with significant expression differences in 1–6 pairwise comparisons. (c) MA plots showing the mean expression across all 28 samples on the x-axis and the log-fold change for one over three other groups. Each dot represents one expressed gene, red dots show genes included in the compiled gene sets. Density plots show frequency distribution of all genes (blue) and of genes in the set genes (red). (d) Venn diagrams comparing phenotype-specific expression differences in WM, EM, QU, and WO. Each Venn diagram shows the number of genes with significantly higher (upper numbers) or lower expression (lower numbers) at an FDR < 0.05 in one, two, or three pairwise comparisons per caste fate. For each caste fate, sets of genes differentially expressed in all three pairwise comparisons (i.e., the central intersection) were used for enrichment analyses.

