
Fig. 4.
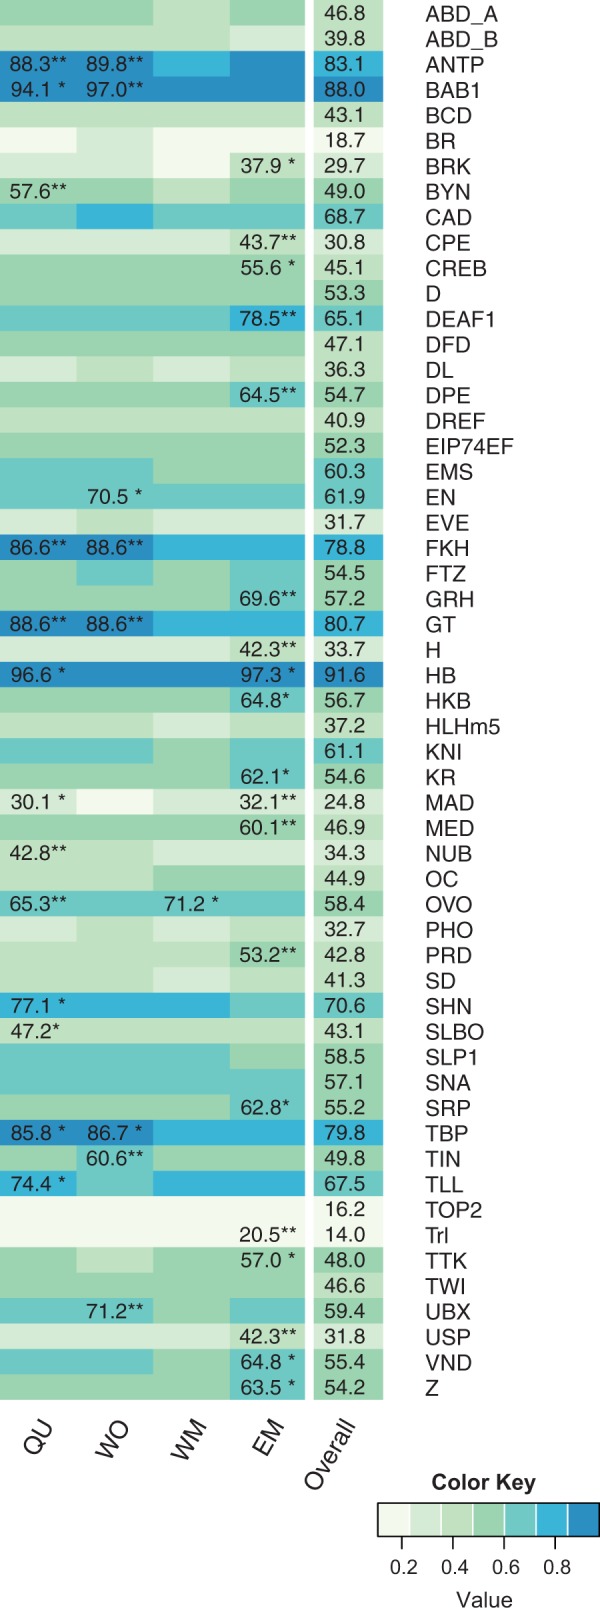
Transcription factor binding site enrichment for caste specific gene sets. The heat map shows the proportion of genes in the different gene sets that have at least one of the respective TFBSs in their promoter sequence. Numbers for significantly enriched/overrepresented TFBSs give the percentage of genes having the respective TFBS in their promotor. Asterisks indicate whether we found significant enrichment (pE < 0.01, asterisk at first position), overrepresentation (pP < 0.01, asterisk at second position), or both (two asterisks).