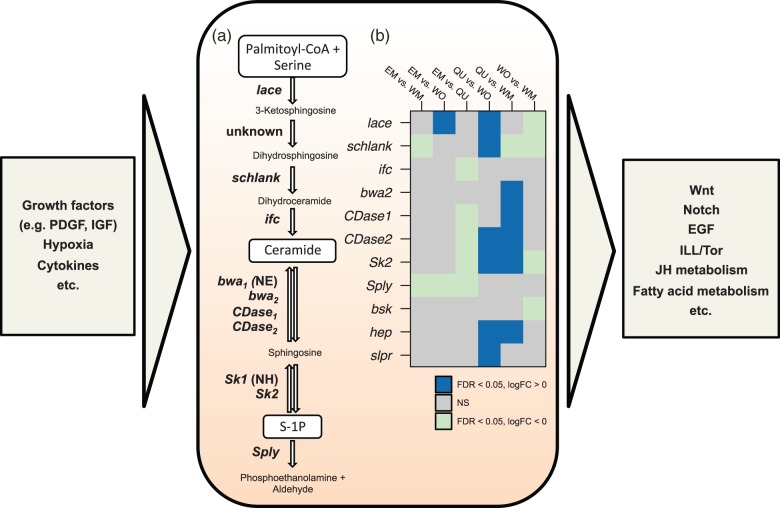
Fig. 5.
Schematic representation of the sphingomyelin cycle (central box) and its involvement with other developmental pathways and mechanisms (left and right boxes). (a) The central metabolism in sphingolipid biosynthesis (Walls et al. 2013) with the involved genes (left of arrows) and metabolic products (between arrows). (b) Differential expression of key genes of the sphingomyelin cycle. The heat map shows significant (FDR < 0.05) positive (dark blue) or negative (light blue) log fold changes for each of the six pairwise comparisons in sphingomyelin cycle and downstream genes (basket [bsk], hemipterous [hep], slipper [slpr]). CDase2 and bwa2 are homologs to the Drosophila CDase and bwa genes, respectively. NH, no homolog identified in C. obscurior; NE, not expressed; NS, no significant difference.

