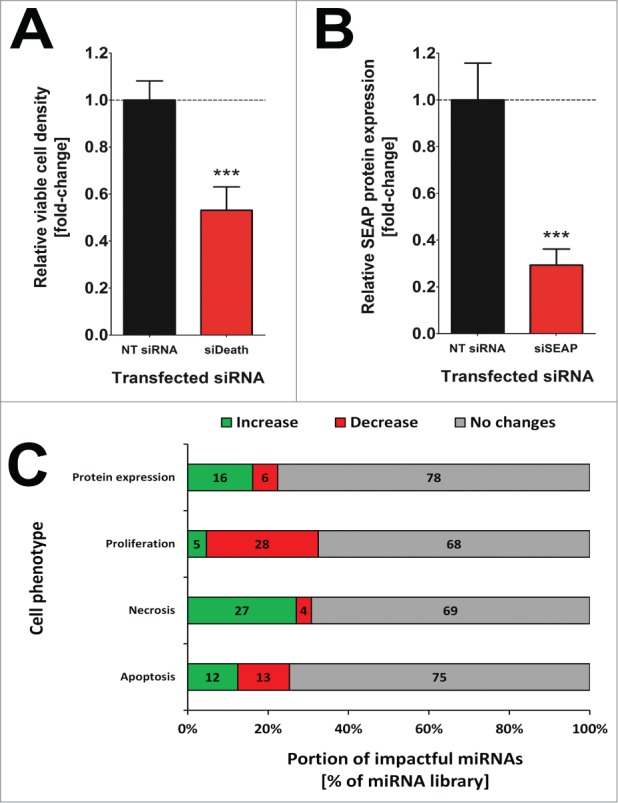
Figure 1:

Confirmation of functional small ncRNA transfection on all miRNA screen plates (n=73) in the primary miRNA screen. Normalized mean values of (A) viable cell density and (B) SEAP protein expression level of siDeath and siSEAP siRNA transfected CHO-SEAP cells, respectively. Sample values were normalized to the respective NT siRNA transfected on-plate control cells. Data are presented as mean ± s.e.m. and for statistical analysis an unpaired, 2-tailed t-test was applied (*** p <0.001). (C) Overview on how many miRNAs significantly affected crucial cellular processes such as protein expression, cell proliferation, necrosis and apoptosis in CHO-SEAP cells. Data are presented as percentages of the entire miRNA library comprising 1139 murine miRNA mimics and the amount of miRNAs increasing (green) or decreasing (red) observed phenotypes are indicated. miRNAs were considered as impactful if the change in phenotype was statistically significant against the negative control cells.
