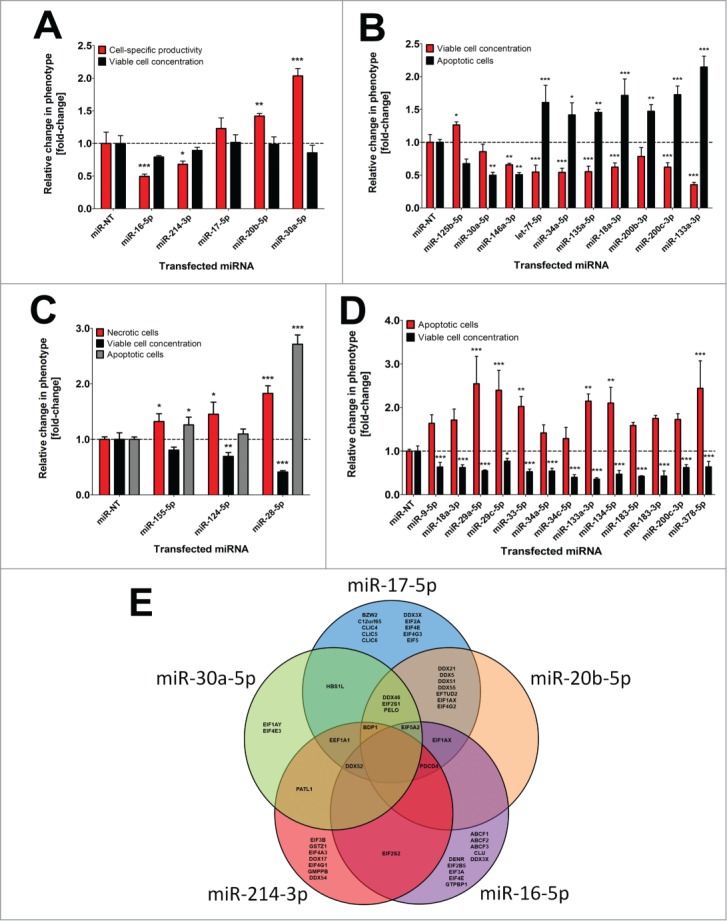
Figure 2:

Influence of single miRNAs on different cell phenotypes in CHO-SEAP cells. (A) Effects of individual pro- and anti-productive miRNAs on SEAP protein level (black) and viable cell concentration (gray) 72 h following transfection in the primary miRNA screen. (B) Effects of individual pro- and anti-proliferative miRNAs on viable cell concentration (black) and apoptosis (gray) 72 h following transfection in the primary miRNA screen. (C) Effects of individual pro-necrotic miRNAs on necrotic (black) and apoptotic (white) cell death as well as viable cell concentration (gray) 72 h following transfection in the primary miRNA screen. (D) Effects of individual pro-apoptotic miRNAs on apoptosis (black) and viable cell concentration (gray) 72 h following transfection in the primary miRNA screen. Triplicate sample values of each miRNA were normalized to the mean value of the miR-NT transfected control cells. Error bars represent the standard deviation (SD) of 3 independent transfections. Statistics: One-way ANOVA (* p <0.05; ** p<0.01; *** p<0.001). (E) VENN diagram of bioinformatically predicted target genes for miR-17–5p, miR-20b-5p, miR-30a-5p, miR-214–3p and miR-16–5p in humans involved in translational control. The five different prediction algorithms miRanda, TargetScan, DIANA-mT, miRDB or miRWalk were used and overlaps indicate shared target genes.
